Bounce rates. Exit pages. User paths. Pageviews. Conversions.
There are a myriad of metrics floating around in the world of websites and when you want to get a healthy pulse on your website metrics, it can be difficult to know how to interpret them to understand your visitors’ true experience.
Fortunately, there are plenty of experts in the marketplace with everything from basic web analytic guides for beginners, down to the nitty-gritty segments that can reveal other layers of data. Today we’ll share some integral website metrics and what they mean for understanding your website’s health.
Traffic Sources & Channels
How are users finding your website? Are they coming from your Facebook posts? Did they type in a search query to Google or Bing? Understanding your traffic channels is important to knowing what methods of promotion — from organic search to social campaigns — are performing.
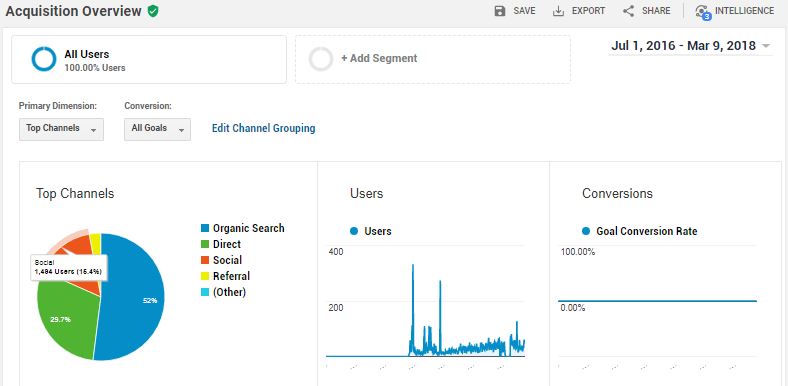
There are some primary traffic sources you’ll see in your Google Analytics dashboard:
Direct Traffic
Direct traffic comes from people who are familiar with your website address or have bookmarked your site. Congratulations!
If you have a physical store, it can also be someone who scanned a QR code from the outlet and came to your landing page.
How do I know if my direct traffic is good? If your direct traffic is first or second highest for your total channels, this means visitors know who you are and how to find you thanks to your smart branding.
Organic Traffic
Organic traffic is thanks to people searching keywords on search engines, like Google or Bing, and landing on your site. They may not always be landing on your homepage, but another interior page that meets their search query.
How do I know if my organic traffic is good? If your content is well-developed and you’ve done keyword research for your brand and competition, you’ll likely see organic traffic taking first or second in your list of traffic sources. If not, you’ll see it much lower.
Social Traffic
Social traffic is specific traffic coming from links you’ve shared or your profiles such as Twitter, Facebook, and more. If you’re invested in maintaining a relationship with your social audience through link sharing, content marketing, or social campaigns, you should see a nice return of visitors on your metrics.
How do I know if my social traffic is good? Social traffic depends on the efforts you’re investing in social presence. If you’re spending money on social campaigns and you’re investing internally in content marketing that’s shared across social channels, you may expect around a quarter of your site’s traffic to be social. If the average users you attract is less than that, you might not be sharing what audiences are interested in.
Referral Traffic
Referral traffic happens from third-party sites that aren’t your own, but that are linking to your website. This is a great benefit, especially if your brand is seen as a leader in your industry. Blogs, for example, are a great place to get referral traffic if other sources rely on your content for reputable information.
Referral traffic can also come in the form of email marketing and branding campaign links. If you’re investing heavily in these areas, you’d like to see a good portion of your traffic coming from referral traffic.
How do I know if my referral traffic is good? Again, it’s relative to what you’re investing in. A great place to start is by building connections with related brands that can link back to your site (if those related brands have steady traffic themselves). If you’re investing in email marketing or other online campaigns, you’ll also want to see a steady flow of traffic here. But if you’re not, you probably shouldn’t expect much for referral traffic to your site.
SEO experts in the digital marketing universe, such as Moz, have great tips about backlinks — why they matter, and how you can get more of them to boost traffic to your site. Check out their backlinks for beginners article to get started.
🎬 Learn what Slickplan can do!
We filmed a short video to show you exactly how to use Slickplan
Landing Pages & Keywords
Landing pages are the lifeblood of your website. They’re the pages users “land” on from the search engine results page, or SERP. While your organization may use landing pages as campaign opportunities, landing pages can really be any interior page of your website, as well as your homepage.

Because users rely on keywords to find your landing pages, understanding the relationship of search words or phrases used and the landing pages your visitors find is an important distinction. Interpreting this data means you should be asking yourself:
- What questions are people trying to answer through keyword search, and is this landing page the right page to help answer that?
- How many of the visits to this landing page result in a conversion?
- Are users on this landing page bouncing quickly and spending little time (which could signify poor content or expectations) or are they staying engaged and traveling other pages of the site?
Answering these questions will give you better visibility to understanding search intent, which is the driving force to adjusting your site architecture and content to meet the needs of your target audience.
Databox, in fact, recommends several metrics within landing pages alone that can be beneficial in interpreting your site’s health and user experience, including — pages per session, goal completions, and visitors-to-contact ratios.
What makes good landing page metrics? Ideally, your landing pages should be engaging and leading to conversion. Setting up goals on Google Analytics, for example, can be a great way to capture conversion opportunities, whether it’s a click-to-call or filling out a contact form for more information.
Depending on the page content, the duration may vary, and depending on the conversion, the bounce rate may not be as valuable if the user is able to complete the intended action.
Queries and Conversion Rates

According to Moz, queries and conversion rates are another essential piece of interpreting website metrics. So long as you have conversion opportunities established on your Google Analytics, you can actually pair queries with conversion completions.
Why do conversions matter? Conversion is what drives your customer funnel, whether it’s hoping your visitors call for an appointment, reach out for an estimate, or start the buying process directly from your website. Conversions tell you how your digital presence is doing when it comes to bringing profit in your door.
Queries, meanwhile, are similar to keywords, except these are search queries where your website appears, but isn’t clicked.
Why do I rank for queries that don’t get clicked? It could be because you have weak metadata, such as page titles and descriptions. While these aren’t a place to keyword stuff like they once were, they are integral to users trying to choose the right “click” for their time and query. If yours are lacking, they could be choosing your competitor. It could also signify competing paid campaigns, meaning you may be ranking high for a keyword, but you’re suffering from a spendy competitor.
Users Flow

Similar to landing pages, keywords, and all the other metrics we mentioned above, user flow in Google Analytics gives you a visual example of how users travel your site. Which page are they likely to enter on, and where do they go next? Where are they exiting from the most?
User flow can be very beneficial to you as you evaluate the content and site structure of your site. For example, a confusing information architecture (IA) may lead to a jumbled user flow, quick jumps between pages, or high bounce rates. If users can’t understand where they need to go on your site, they may click the ‘Back’ button and not come back.
Similarly, if your content isn’t delivering the answers or information users are seeking — from products to services to job opportunities – they’ll also not have a standard “flow.”
Consider finding the gaps in these experiences with an empathy map, and work backwards with the IA you have. Are there specific paths or journeys users should be able to easily follow through your site if they start with a certain page? If this isn’t clear, it may be time to adjust.
Need help getting started? Check out Slickplan’s Sitemap Builder or Diagram Maker for ways to brainstorm your IA and user journey in a collaborative platform.


Share & refine designs with Slickplan
Add mockups from Figma or your computer to ensure UX/UI is moving in the right direction.
Metrics Tell You Plenty, But Not Everything
One thing to remember about website metrics is that even if they’re detailed, they may not be telling the whole story. Other tools for verifying (or disproving) your interpretation of website metrics are available for little to no cost so you can get the complete picture. These tools include:
- Heatmapping. Heatmapping code can be added to your site, which reveals where users’ mouse cursors are spending the most time, and where they’re click. It’s a helpful way to see what type of content or IA information may or may not be valuable to your audience, giving you an opportunity to improve the user experience.
- Online surveys. These can also be easily added to your code and is a great way to gain insight and feedback from real users about their experience. Were they able to find what they were looking for? What was their favorite, or least favorite, part of interacting with your website?
- Treejack testing. You can test your website, conversions, and IA with treejack testing. Setting up scenarios for user testing and providing an anonymous group of testers with a primary goal can reveal many things — good and bad — about the direction your site experience is taking.
- Focus groups and real user interviews. Getting to know your audience face-to-face can also tell you a lot about how users are engaging with your site. While your metrics may set the tone for the conversation you have, user replies and experiences may surprise you and tell you things that typically aren’t visible in analytics data. Though this process may be more expensive and time-consuming, it can be incredibly rewarding to hear about your website from the real people who use it.
Want to know more about user research tools? Check out UX Booth’s “Complete Guide to Analytics and Measurement”, which includes links to many tools to get you started beyond Google Analytics.


 X
X