![How to create a flowchart [visual guide + free templates]](https://cdn-proxy.slickplan.com/wp-content/uploads/2025/04/Covers-min-900x300.jpg)
A flowchart is a type of diagram used to visualize all the steps in a process from start to finish. Simple, no?
Good news, it’s as easy to make a flowchart as it is to define one, and in this guide, we’ll walk through how to create a flowchart with Slickplan, step-by-step, helping you detail processes and create a deeper understanding for your team and your users.
Key takeaways
- Define a clear purpose and identify key steps before creating a flowchart so the flowchart is as effective as possible.
- Use the right tools, flowchart symbols, and templates to make the flowchart creation process more efficient and clarify the final diagram.
- Include your team and other stakeholders, gather feedback, and refine the flowchart.
If you’re more of a visual learner, we go over some of the key insights in this video:
🎬 Learn what Slickplan can do!
We filmed a short video to show you exactly how to use Slickplan
How to make a flowchart
Whether your goal is to improve a business process, a manufacturing workflow, or document the steps of a training process, a flowchart — or flow diagram — is the quickest way to see where things stand and get everyone on the same page.
There’s no need to get overly fancy with your diagrams. The best flow charts are the ones that illustrate the point without unnecessary fluff.
Flowchart basics: symbols and connectors
Before we jump into building a flowchart, let’s get familiar with the visual language used in all flowcharts.
Think of this as your toolbox. These flowchart symbols and connectors are universally understood, meaning you’ll be using the same ones no matter which diagramming tool you use.
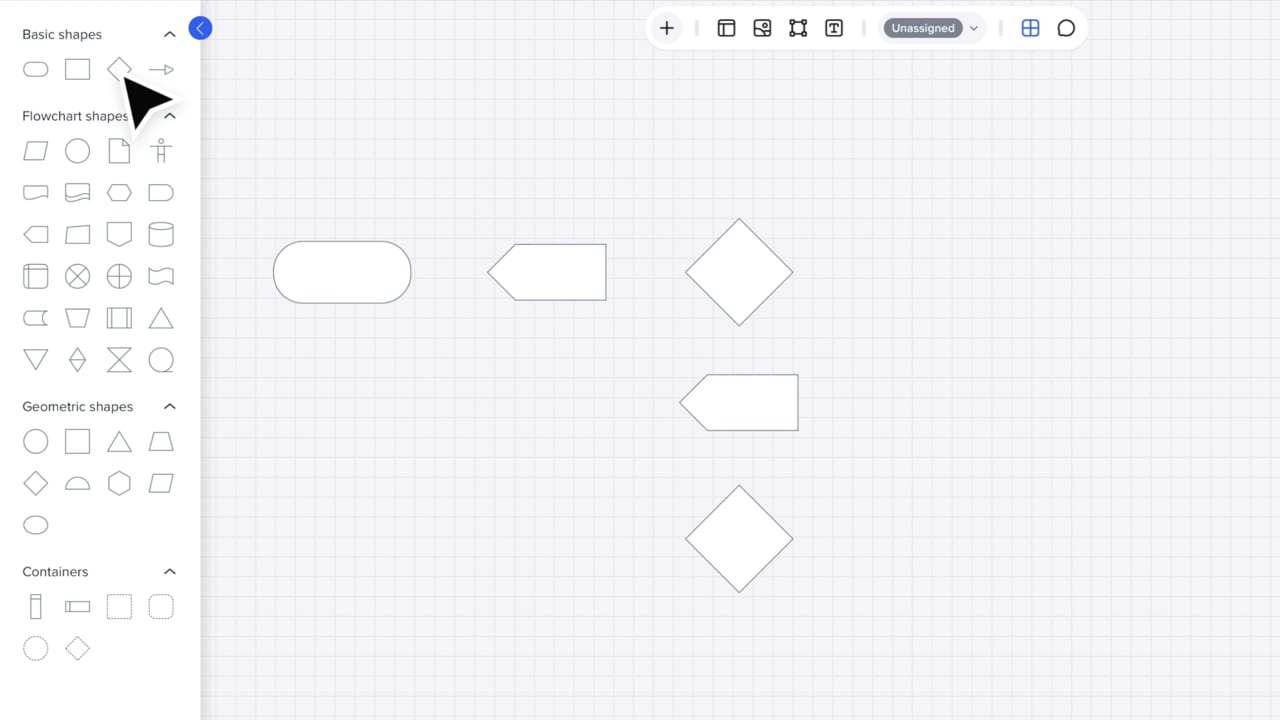
Symbols and shapes
Every shape in a flowchart has a specific meaning. From start/end points to actions and decisions, each symbol plays a unique role.
For a full breakdown of each symbol, check out our flowchart symbols guide — an interactive resource covering each shape in detail, with a downloadable PDF for quick reference.

In Slickplan, adding symbols is simple: pull out the sidebar menu, pick your symbol, and drag it wherever it’s needed in your diagram.
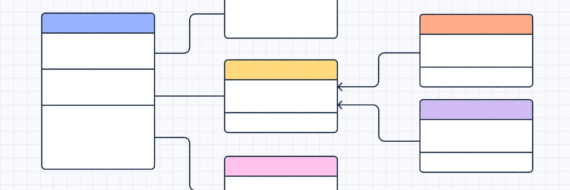
Connectors and arrows
Connectors and arrows are the links between flowchart steps. They give your diagram both direction and meaning while telling your intended audience where to go next.
Using our diagram creator, hover your mouse over a shape and directional arrows will automatically appear. Drag one to the next shape to create a connection.
Quite an intuitive flowchart maker.
Now that you know the basics, here’s a quick outline of the process to create flowcharts:
- Lock in the purpose
- Pick a template
- Determine and label steps
- Add loops
- Create decision and split paths
- Test and refine
- Customize your flowchart
- Export and share
Let’s jump into our Diagram Maker tool using a free checkout process template as an example. The first few steps are about planning and getting familiar with the language of flow chart diagrams. The remaining steps are about building.

1. Brainstorm the purpose or function
When creating a flowchart, there needs to be a problem, task, or question — some sort of starting point. You’d never just start adding flowchart shapes haphazardly. There has to be a reason for opening up the flowchart maker.
Showing a new employee the ropes? Planning a new sales process? Reworking data flows? Those are all going to look different in a flowchart – and depending on the level of detail and workflow, you might want to consider using process mapping tools specialized in documenting more complex systems.
So, before you start putting steps together, get a solid understanding of what this system you’re visualizing should do, answer, or resolve, because a swimlane flowchart serves a different purpose than user flow diagrams do.
Once you have that locked in, jot down the steps in the process that you’re planning to explain.
To get started in Slickplan, it’s as simple as opening a new project for focused diagramming or attaching a diagram to a page within a sitemap project.
Start a diagram project:

Or, add a sitemap diagram:

To learn how to create a diagram project, follow this guide. If you’d like to add a diagram to a website planning project, use this guide instead.
2. Pick a template
Sure, you can start with a blank canvas, but if you’re using any of the best flowchart software options on the market, they’re going to come with loads of free templates, which are a great way to get the ball rolling and save time.
Slickplan has a large selection of no-cost diagram templates available, covering user flows, business processes, workflows, process mapping, and more.
Speaking of process maps, learn the difference between process maps vs flowcharts and how to create a process map.
Inside Slickplan, you can access the built-in flowchart templates when you start a new project.

3. Determine and label the steps
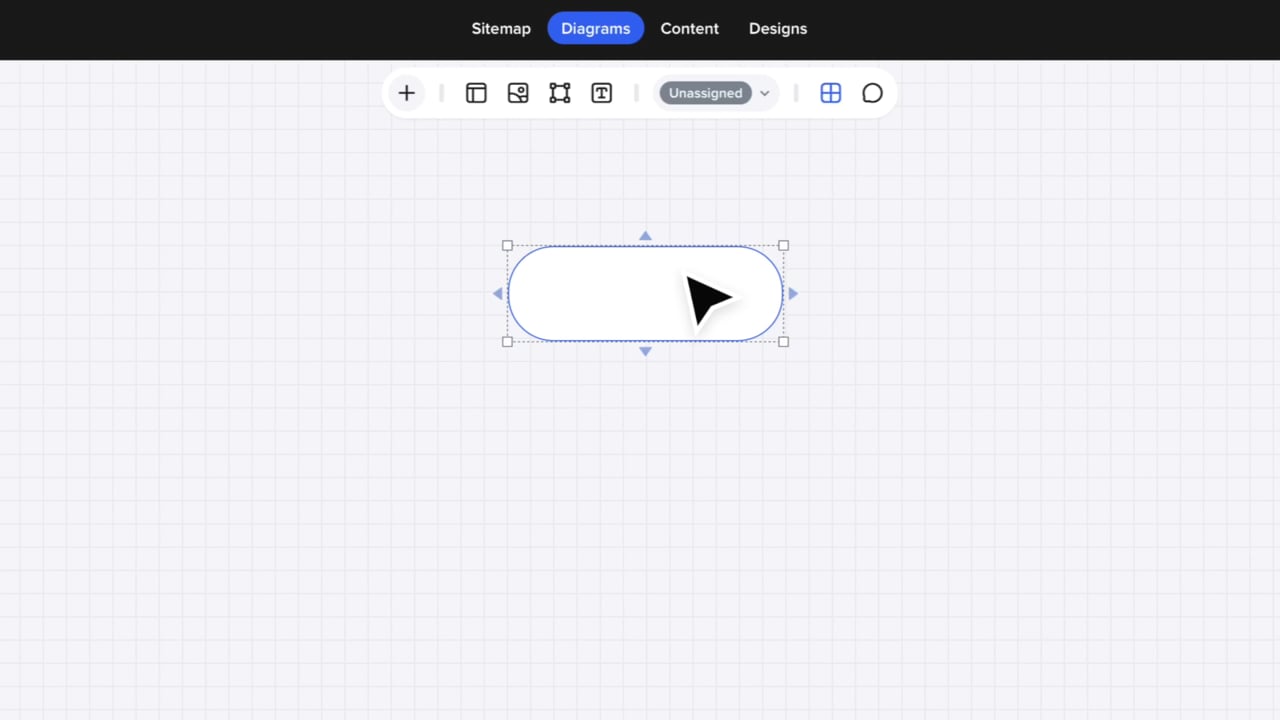
Grab that list of steps you put together earlier and begin to add shapes and build the structure of your flowchart.

✏️Label everything: Don’t keep people guessing with unlabeled shapes — double-click the symbol to add text.
If you need to duplicate symbols or connectors, grab them with your mouse or click them one at a time while holding Ctrl on Windows or ⌘ on Mac. Then use the standard Ctrl+C or ⌘+C (Command+C) to copy and Ctrl+V or ⌘+V to paste.
4. Add loops back to previous steps
Loops in a flowchart are a way to represent repeated actions or steps that cycle back to an earlier point in a process until a specific condition is met. In other words, they send the flow back to a previous step instead of moving to the next one, creating a circular pattern.
They’re essential for visualizing tasks that don’t just move forward in a straight line but need to repeat—like checking something multiple times or refining work until it’s complete.
You’ll use a loop when your process hits a decision point, usually a diamond shape that we’ll discuss next, and, based on the answer, either continues forward or returns to an earlier step. Think of it as a "do this again" instruction.
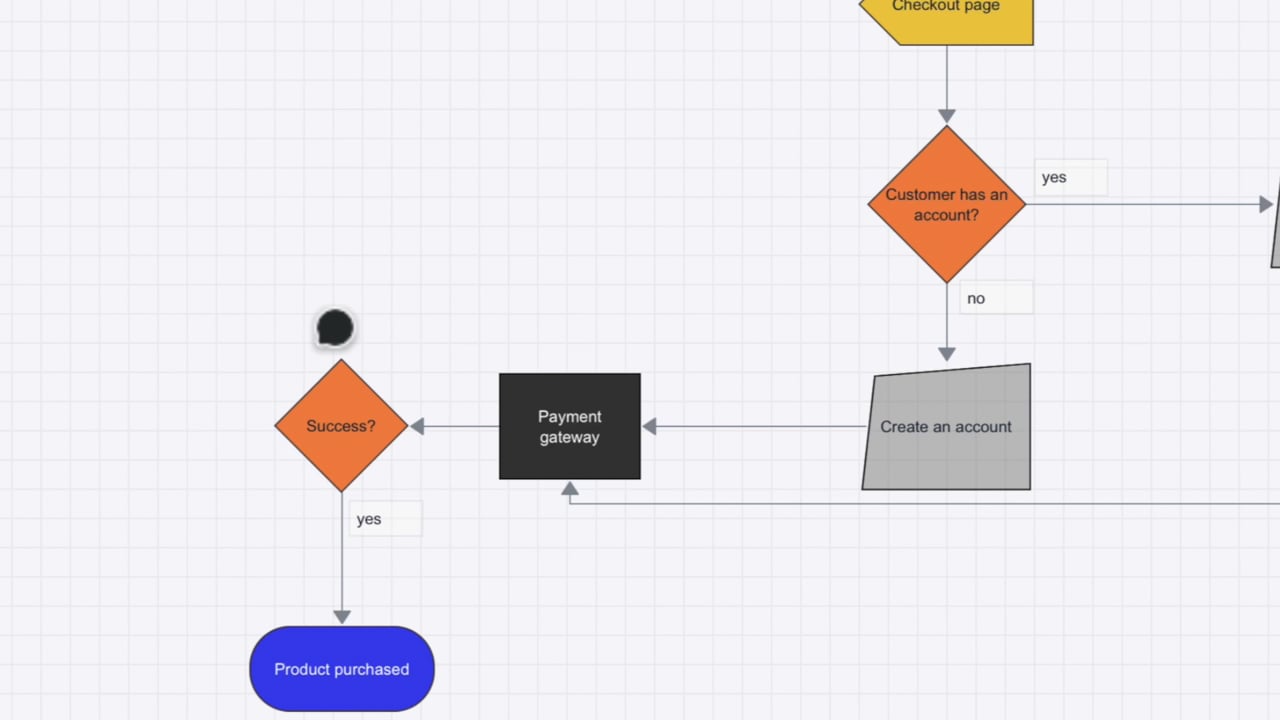
In a quality control process, for example, you might check a product (“Is it up to standard?”). If "no", you loop back to "Fix the product" and check again. If "yes", you move on. In our checkout process, we have a loop on the payment gateway.

Add loops to your diagram in the same way you do for connections and arrows by dragging from a shape. Slickplan anticipates how to connect to the next shape as you drag your mouse and point it back toward an existing step.
Keep in mind, the goal here is to get a "yes" and move to the next step. Too many loops in your flowchart mean there’s potentially an issue with your process. The main point of mapping out the steps in the first place is to find these problems, identify bottlenecks and correct them.
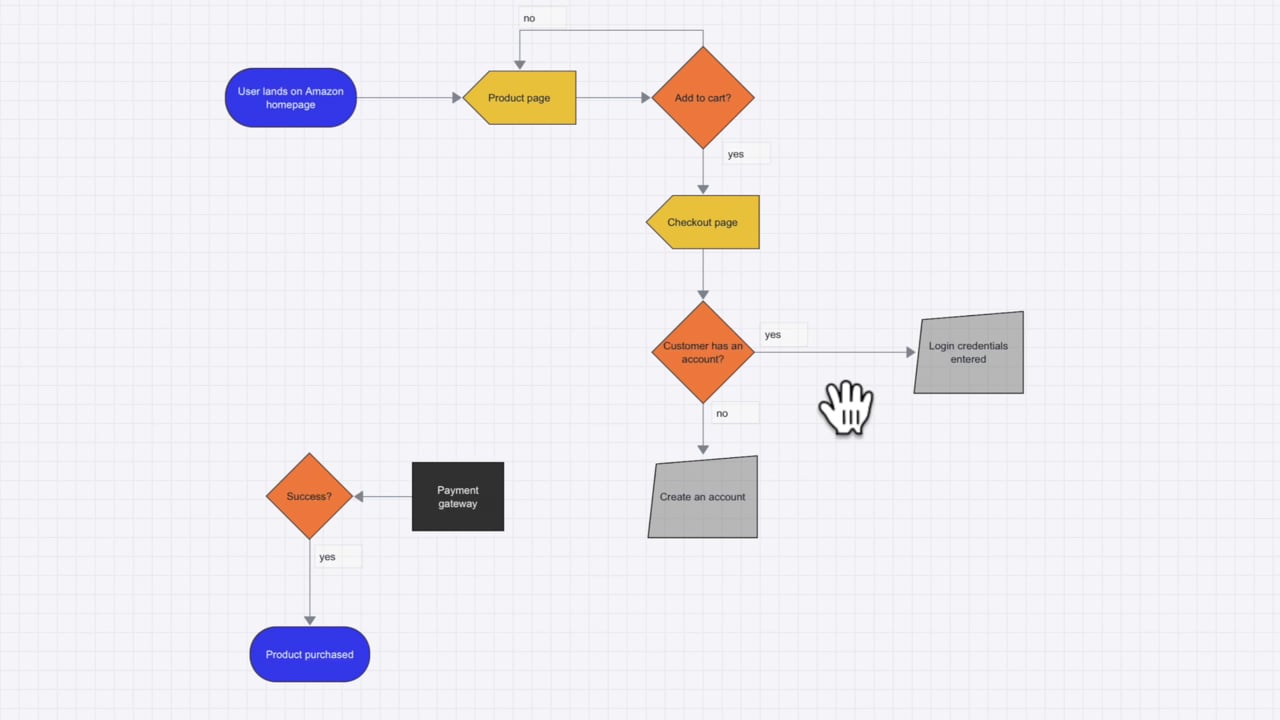
5. Create the decisions and split paths
Decisions and split paths have some similarities, but are used in different situations.
Decisions are shown in a diamond shape and involve a question.
A split path uses a rectangle, and the outcome can vary.
An example of a split path could be something like the end of a survey. Either the customer has entered their answers, and we thank them, or they may have reported a problem, and we can let them know someone will reach out to address their problem personally.
Each of these will likely be used at least once in any flowchart because yes/no questions, as well as decision points, are going to be needed along the way.
In our example, does the customer have an account? Was this transaction a success and can they move to the next step? These are decision points where you’ll use the diamond shape and the rectangle will be the answer to these decision points.
If the customer doesn’t have an account, they’ll loop back to create one and then move forward in the process.
Speaking of decisions, if you’re looking for a way to systemize the process of making them, a decision tree is your go-to.

6. Test and refine
Now it’s time to assess your flowchart.
Alongside your team, go through the chart as if you were a customer or end user. Anything that’s a problem needs to be addressed and fixed.
In Slickplan, you can leave feedback directly on shapes and arrows and have discussions about how to smooth out trouble spots. Of course, emoji reactions are available for ya too 😉
7. Customize the flowchart
The shapes, symbols, lines, connectors, arrows, fill colors, etc., can all be colored in. Sizing and style choices can make a flowchart easier to understand and a little easier on the eyes too.
These customizations become more important and more helpful on larger flowcharts.
In Slickplan, click individual items or select multiple items into a large group to bring up a menu at the bottom of the page to change colors of fill, borders and text.

Lines can be done separately, the menu allowing you to customize endpoints and the line style.

8. Export your flow chart
The final thing to do is to export and share your flowchart.
With a few clicks, you can have a file ready to download. Just pick the file type you need — PNG, PDF, XML or vector — and you’re good to go.

If you’re in focused diagramming mode, the Export button is up in the top right side of the screen.

If you’re doing a full website project, the Export buttons are in the top left and right side of the screen.

Keeping your flowcharts in Slickplan, whether as their own projects or attached to pages of a website planning project, can help slim down the number of apps needed to get the job done and avoid miscommunications from misplaced or unseen comments.
Flowchart rules
Now that you know the basics of making a flowchart online, let’s lay down some ground rules and guardrails to improve execution. These apply to everything from basic flowcharts to complex systems to the most imaginative, detail-heavy, multi-process flowcharts.
- They should be simple and leave nothing to the imagination
- Loop lines never intersect another connection, they go under other lines
- Flowcharts always go from left to right or from top to bottom
- There needs to be a starting and stopping point using a terminator symbol
Start building your own flowchart now
Flowcharts are simple yet powerful tools for visualizing tasks, workflows, and complex processes. By following the steps outlined in this guide, you can create effective and easy-to-follow flowcharts that improve decision-making.
Get started now with our 14-day free trial — no credit card required — including our diagram maker for flowcharts and find out what makes us one of the most trusted names in diagramming and website planning.


Think visually. Improve UX with Slickplan
Build intuitive user flows, stronger customer journeys and improve information architecture.
Frequently asked questions
What is the best program to create flowcharts?
Slickplan is the best flowchart maker. Intuitive, packed with free templates and easy to use. Drag flowchart shapes, connect with arrows and visualize complex processes fast. You can also integrate your flowcharts with the rest of your website planning process and take care of everything in one place.
How to make a flowchart online?
Start with a template or blank canvas and begin creating your flowchart. Add flowchart symbols and shapes, drag arrows to connect steps and bring your process or workflow to life. Tweak and refine with your time and then export. Simple, quick and all in one place.
What are the basic rules of writing a flowchart?
Keep it simple. Use the right flowchart symbols to create meaning and add arrows for direction. Flow should go from left to right or top to bottom. Don't crisscross your lines or loops. Start and stop with terminators. Label steps clearly to avoid confusion. Do all that and you'll nail your flowchart.
What is the purpose of a flow diagram?
A flow diagram is used to visualize the sequence of actions and decision points within a system, making processes easier to understand, analyze, and improve. This clarity allows you to do everything from spot bottlenecks to streamline complex systems to workflow management.


 X
X