
UML diagrams help you visualize complex systems clearly, turning confusing processes into visuals that everyone can understand.
This guide breaks down the most common types of UML diagrams, when to use them, and how to build your own (step-by-step). Whether you’re working on software, complex systems or business processes, the Unified Modeling Language (UML) is the toolkit that brings it all together.
Key takeaways
- UML diagrams give teams a shared, standardized way to design and document systems, helping developers and stakeholders stay aligned.
- There are two main types: structural diagrams (for what a system is) and behavioral diagrams (for what a system does).
- To build better diagrams, define the goal first, keep it simple, use templates and collaborate early with your team.
What is a UML diagram?
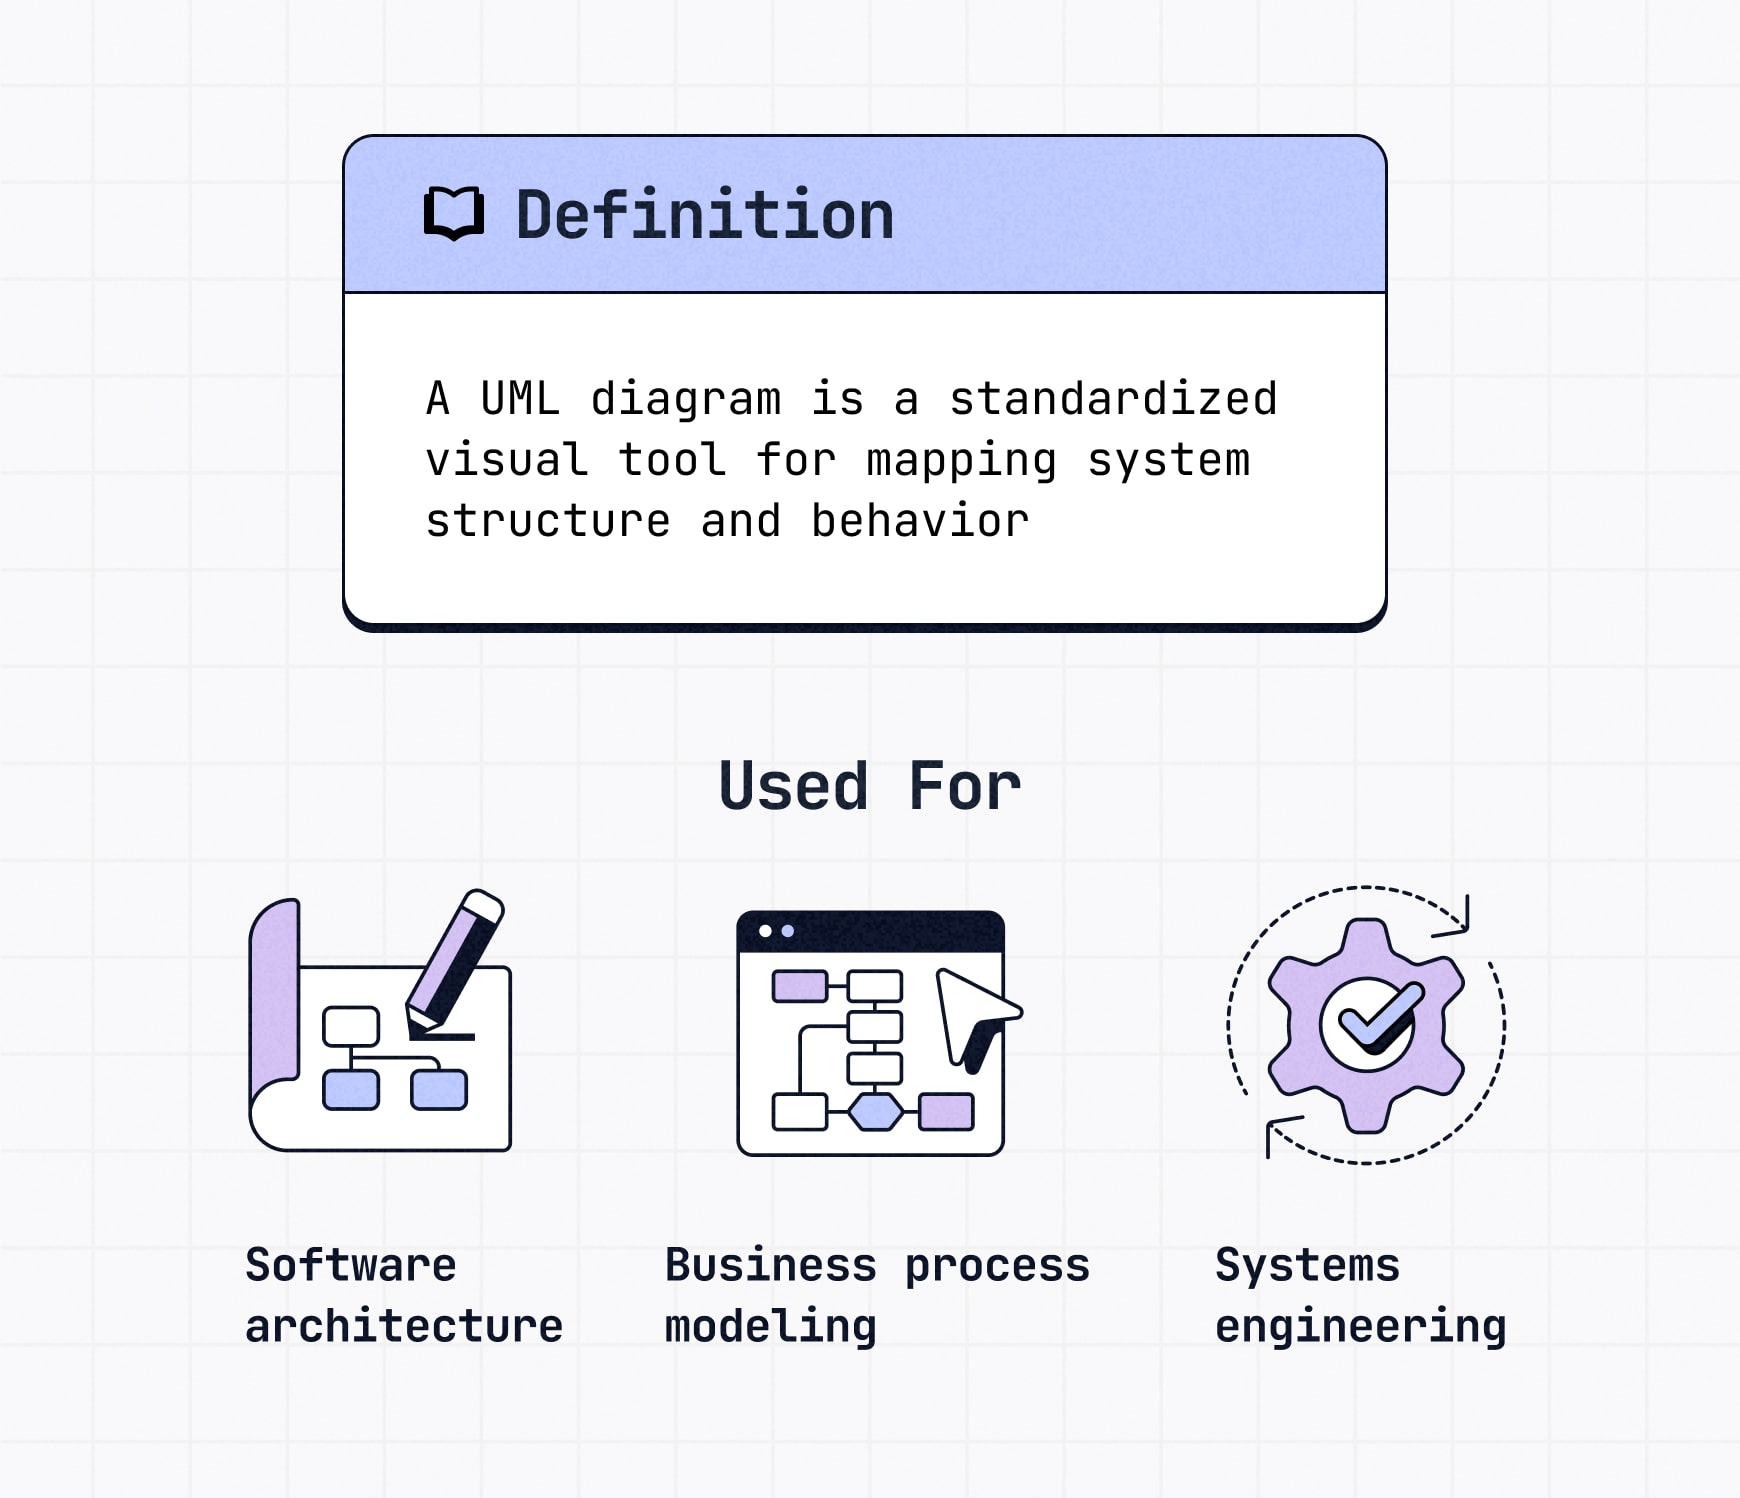
A UML diagram uses standardized symbols to clearly show how a system is structured or how it behaves.
Short for Unified Modeling Language, UML isn’t a programming language but rather a formal way for software developers, architects and business teams to map systems, plan features and understand workflows. Think of it as a city map for software and other systems, illustrating the different components and the roads that connect them.
Instead of long documentation, a UML diagram shows how parts like classes, objects and users connect and interact. You’ll see them used in:
- Software architecture — for designing applications and data models
- Business process modeling — to map workflows and internal systems
- Systems engineering — to plan and maintain large infrastructures
Unlike general flowcharts, UML diagrams follow their own standard notation and rules, which makes them easier to share, scale and update across teams.
Want to jump straight into building your own? Try our diagram creator to start visualizing your system architecture in minutes.
🎬 Learn what Slickplan can do!
We filmed a short video to show you exactly how to use Slickplan
Types of UML diagrams
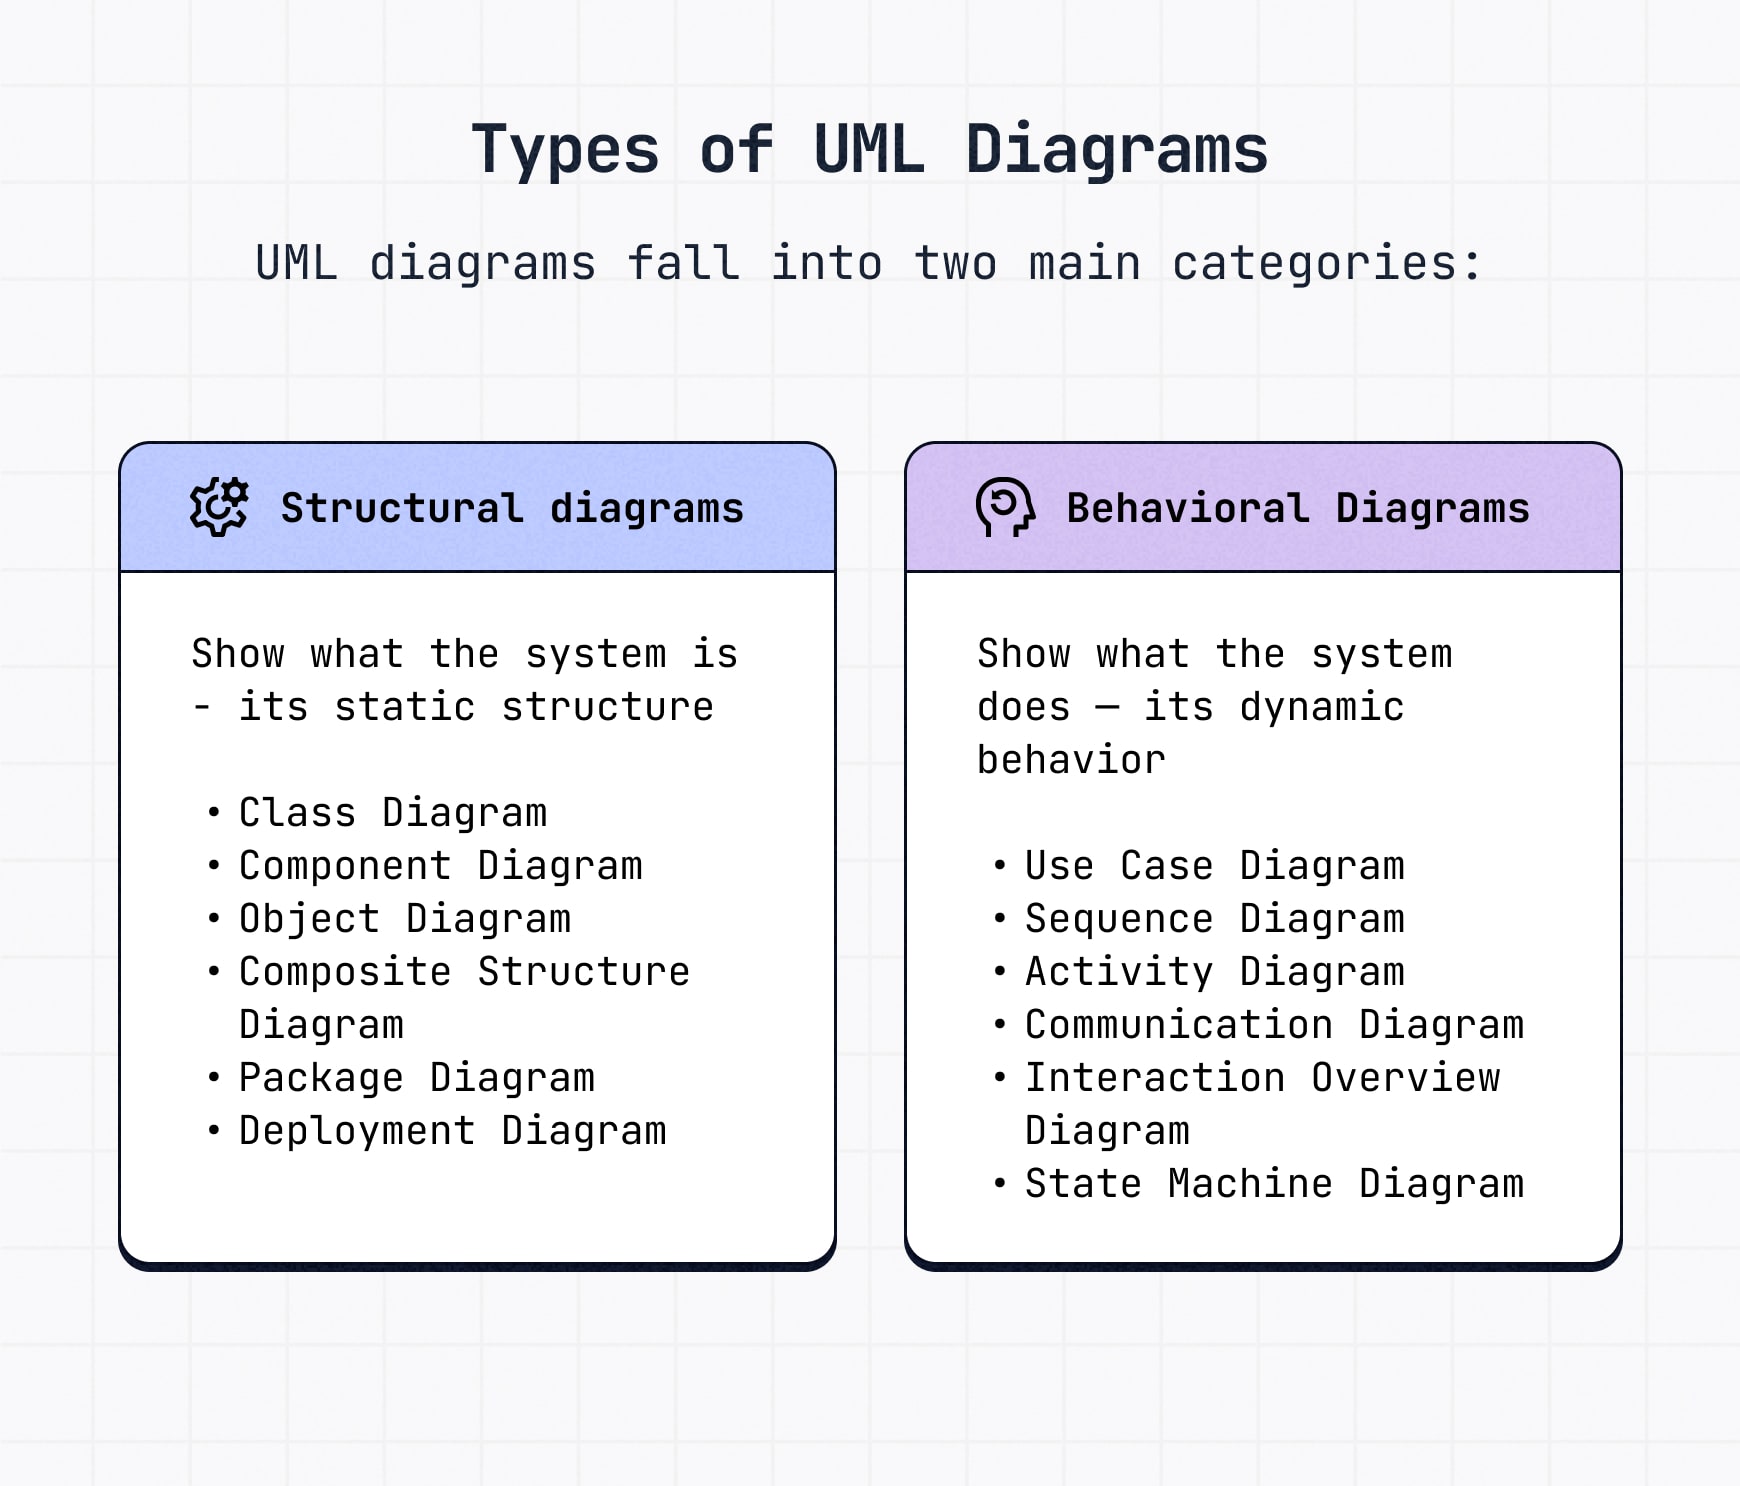
Not all UML diagrams are created equal — different types are built for different jobs. Some focus on the static aspects of a system, while others map out how everything moves and interacts over time.
There are two main categories: structural diagrams and behavioral diagrams. We’ll break them both down along with the most common ones you’ll see in each silo.
Structural UML diagrams
Structural diagrams show the parts of a system that stay put — its backbone.
These are visual representations of static structure, things like classes, components and the relationships between them.
If you’re designing how things are organized behind the scenes, this is your go-to.
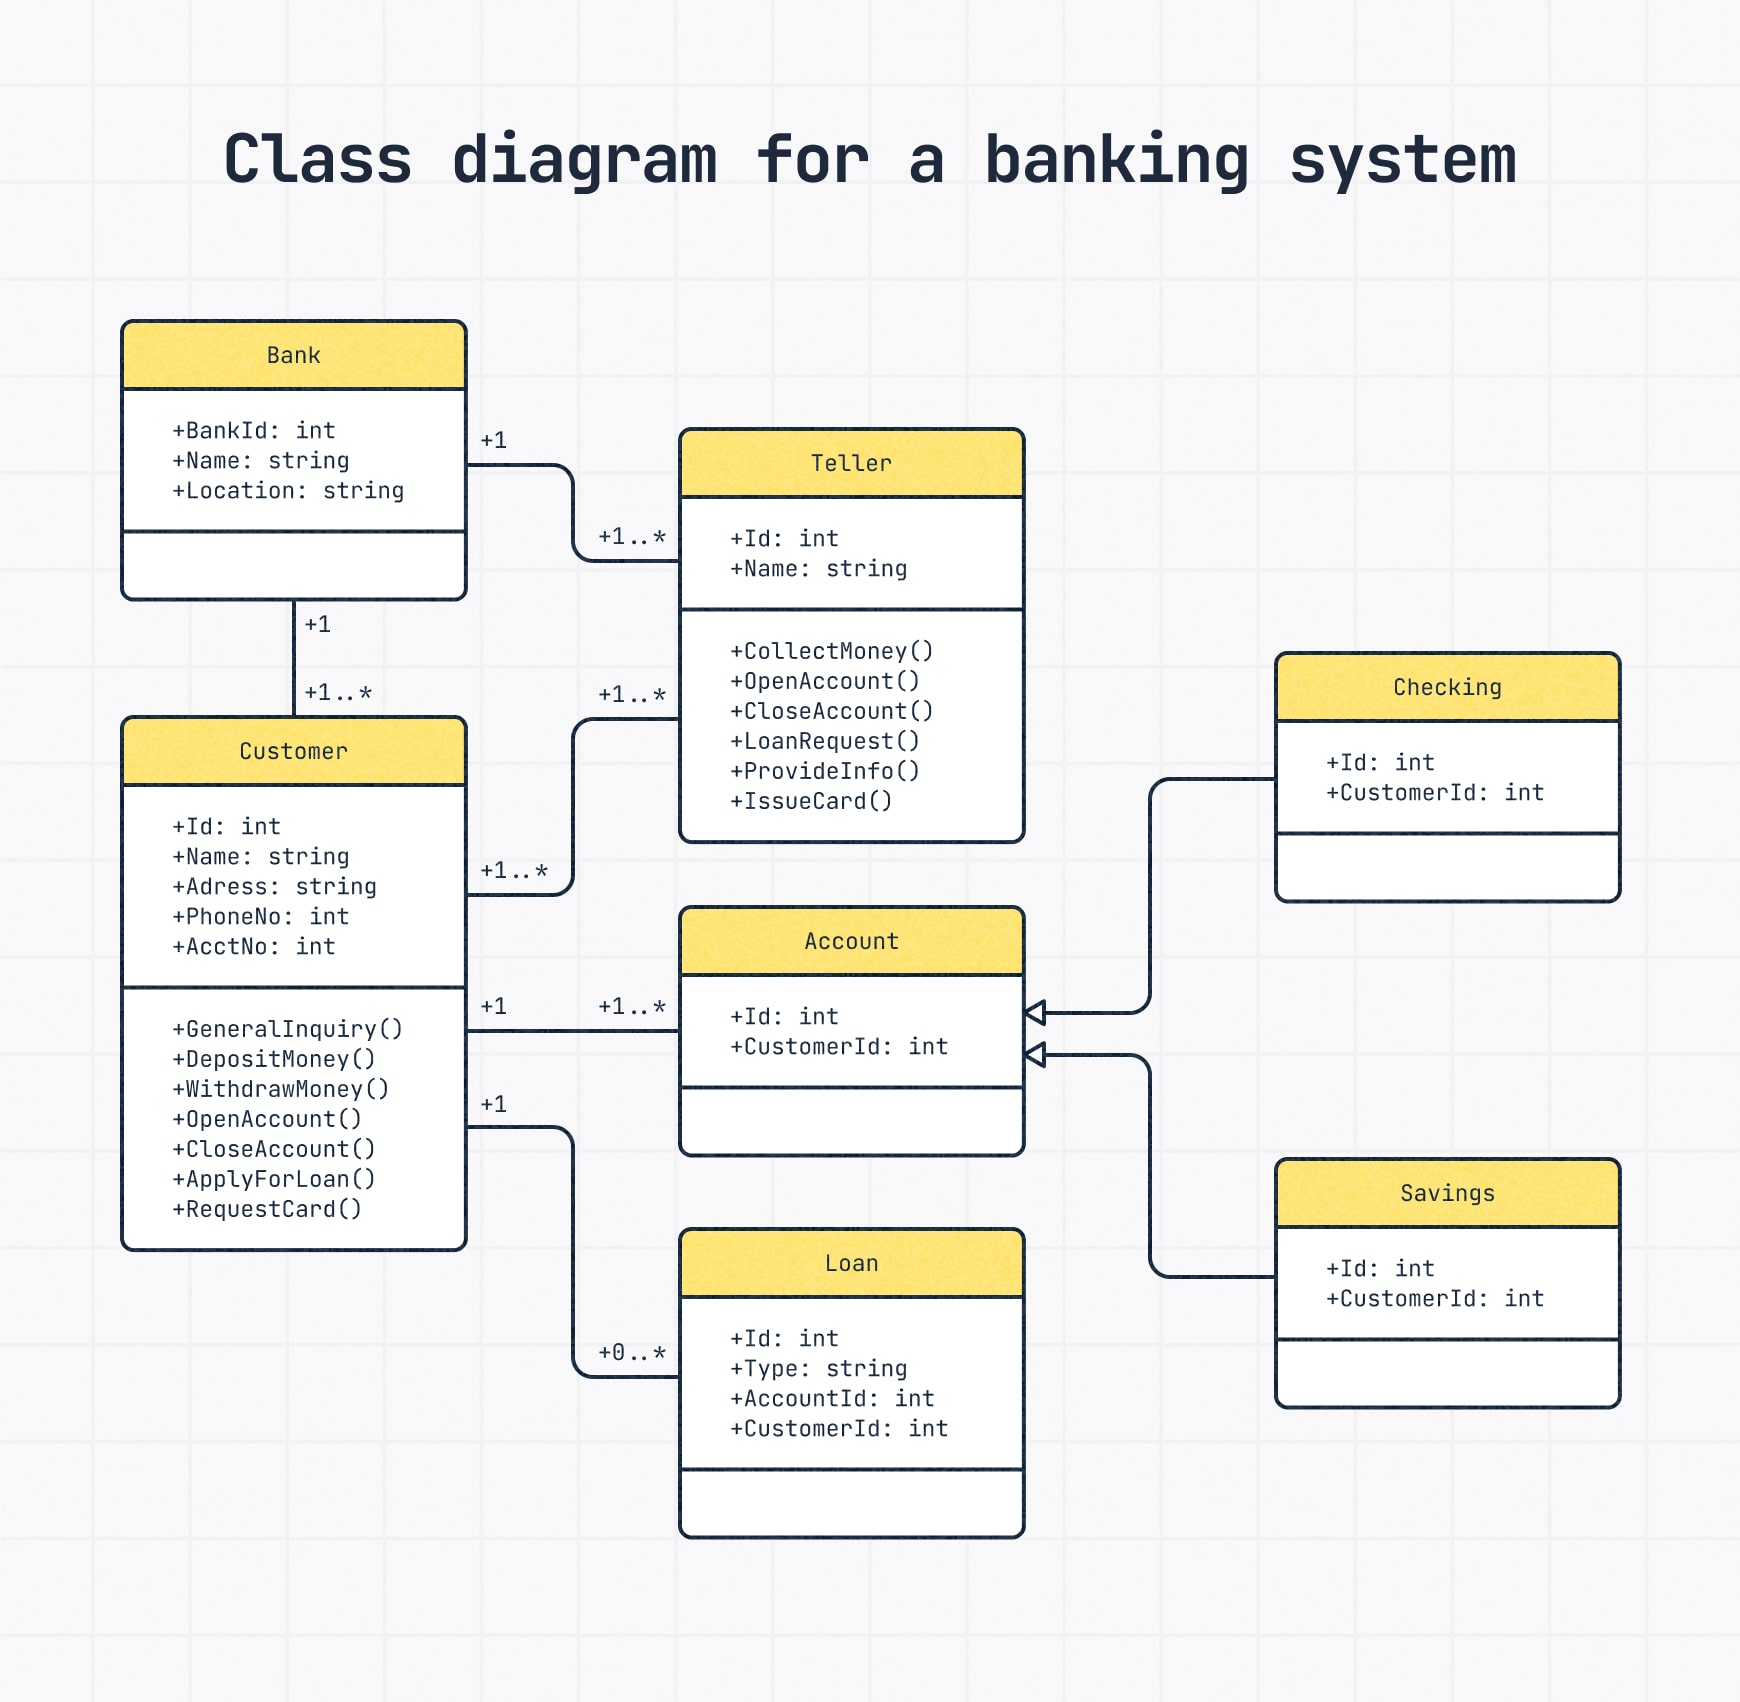
Class diagram
A UML class diagram lays out the key elements of a system: classes, their attributes, methods, and how they relate to each other. Think of it as a blueprint for how data is organized.
- Class attributes define the properties each object holds.
- Class operations (or methods) show what actions the class can perform.
- Relationships between classes, generally shown with a solid line, define how objects interact.
Class diagram example: A diagram of a bank highlighting the classes involved, including Bank, Customer, Teller, Account, Checking, Savings and Loan, along with their attributes and operations.
Component diagram
A component diagram focuses on larger chunks of a system — the software components that make everything work together. These diagrams are ideal for visualizing software architecture or hardware components at a high level.
Picture it like building blocks for software. Each block (rectangle) is a part of the system with a specific job.
Some blocks offer services (circles) that others need to use (half-circles). The lines show which blocks are connected because one needs a service from the other.
When you need to see how different parts plug into a bigger application, a component UML diagram is your go-to.
Component diagram example: An online shopping system made of a few main parts: Customer, Order, Persistence and Security.
The Customer and Order parts handle shopping actions. Persistence stores the data. Security keeps everything safe.
The arrows show how the parts depend on each other to make the whole system work.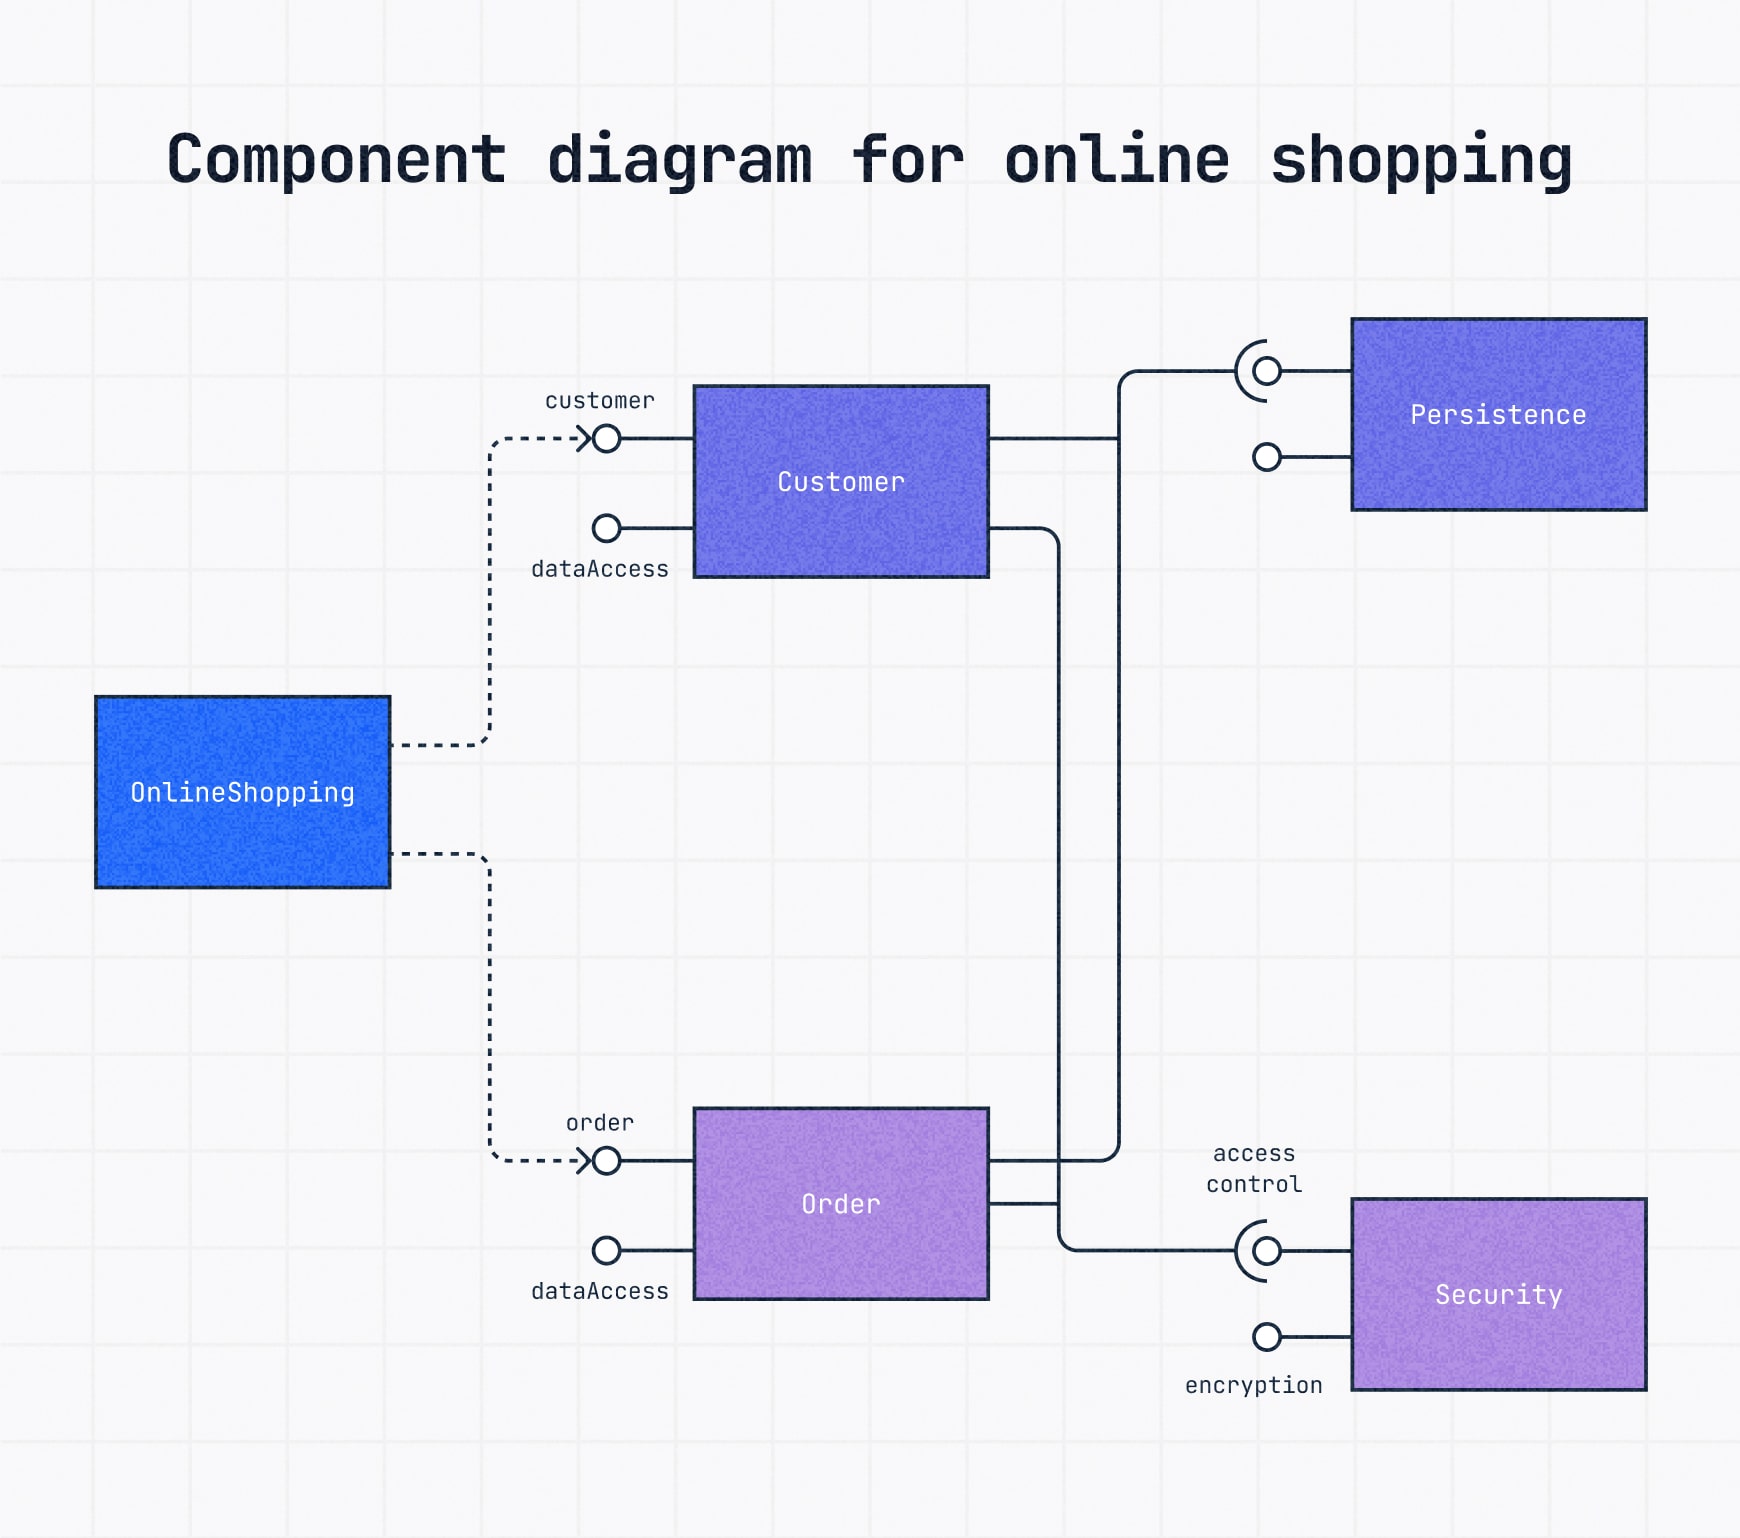
Object diagram
Object diagrams capture a snapshot of the system at a specific point in time.
They show how objects interact based on a class diagram structure, but reflect real-world examples of the system in use. Look at it as the objective reality of a system as it is in that moment.
Object diagram example: A company structure at a specific moment, showing a Company with Sales and R—D Departments. The Sales Department has a US Sales sub-department where Sammy, a Supervisor with a specific ID, works and has particular contact information.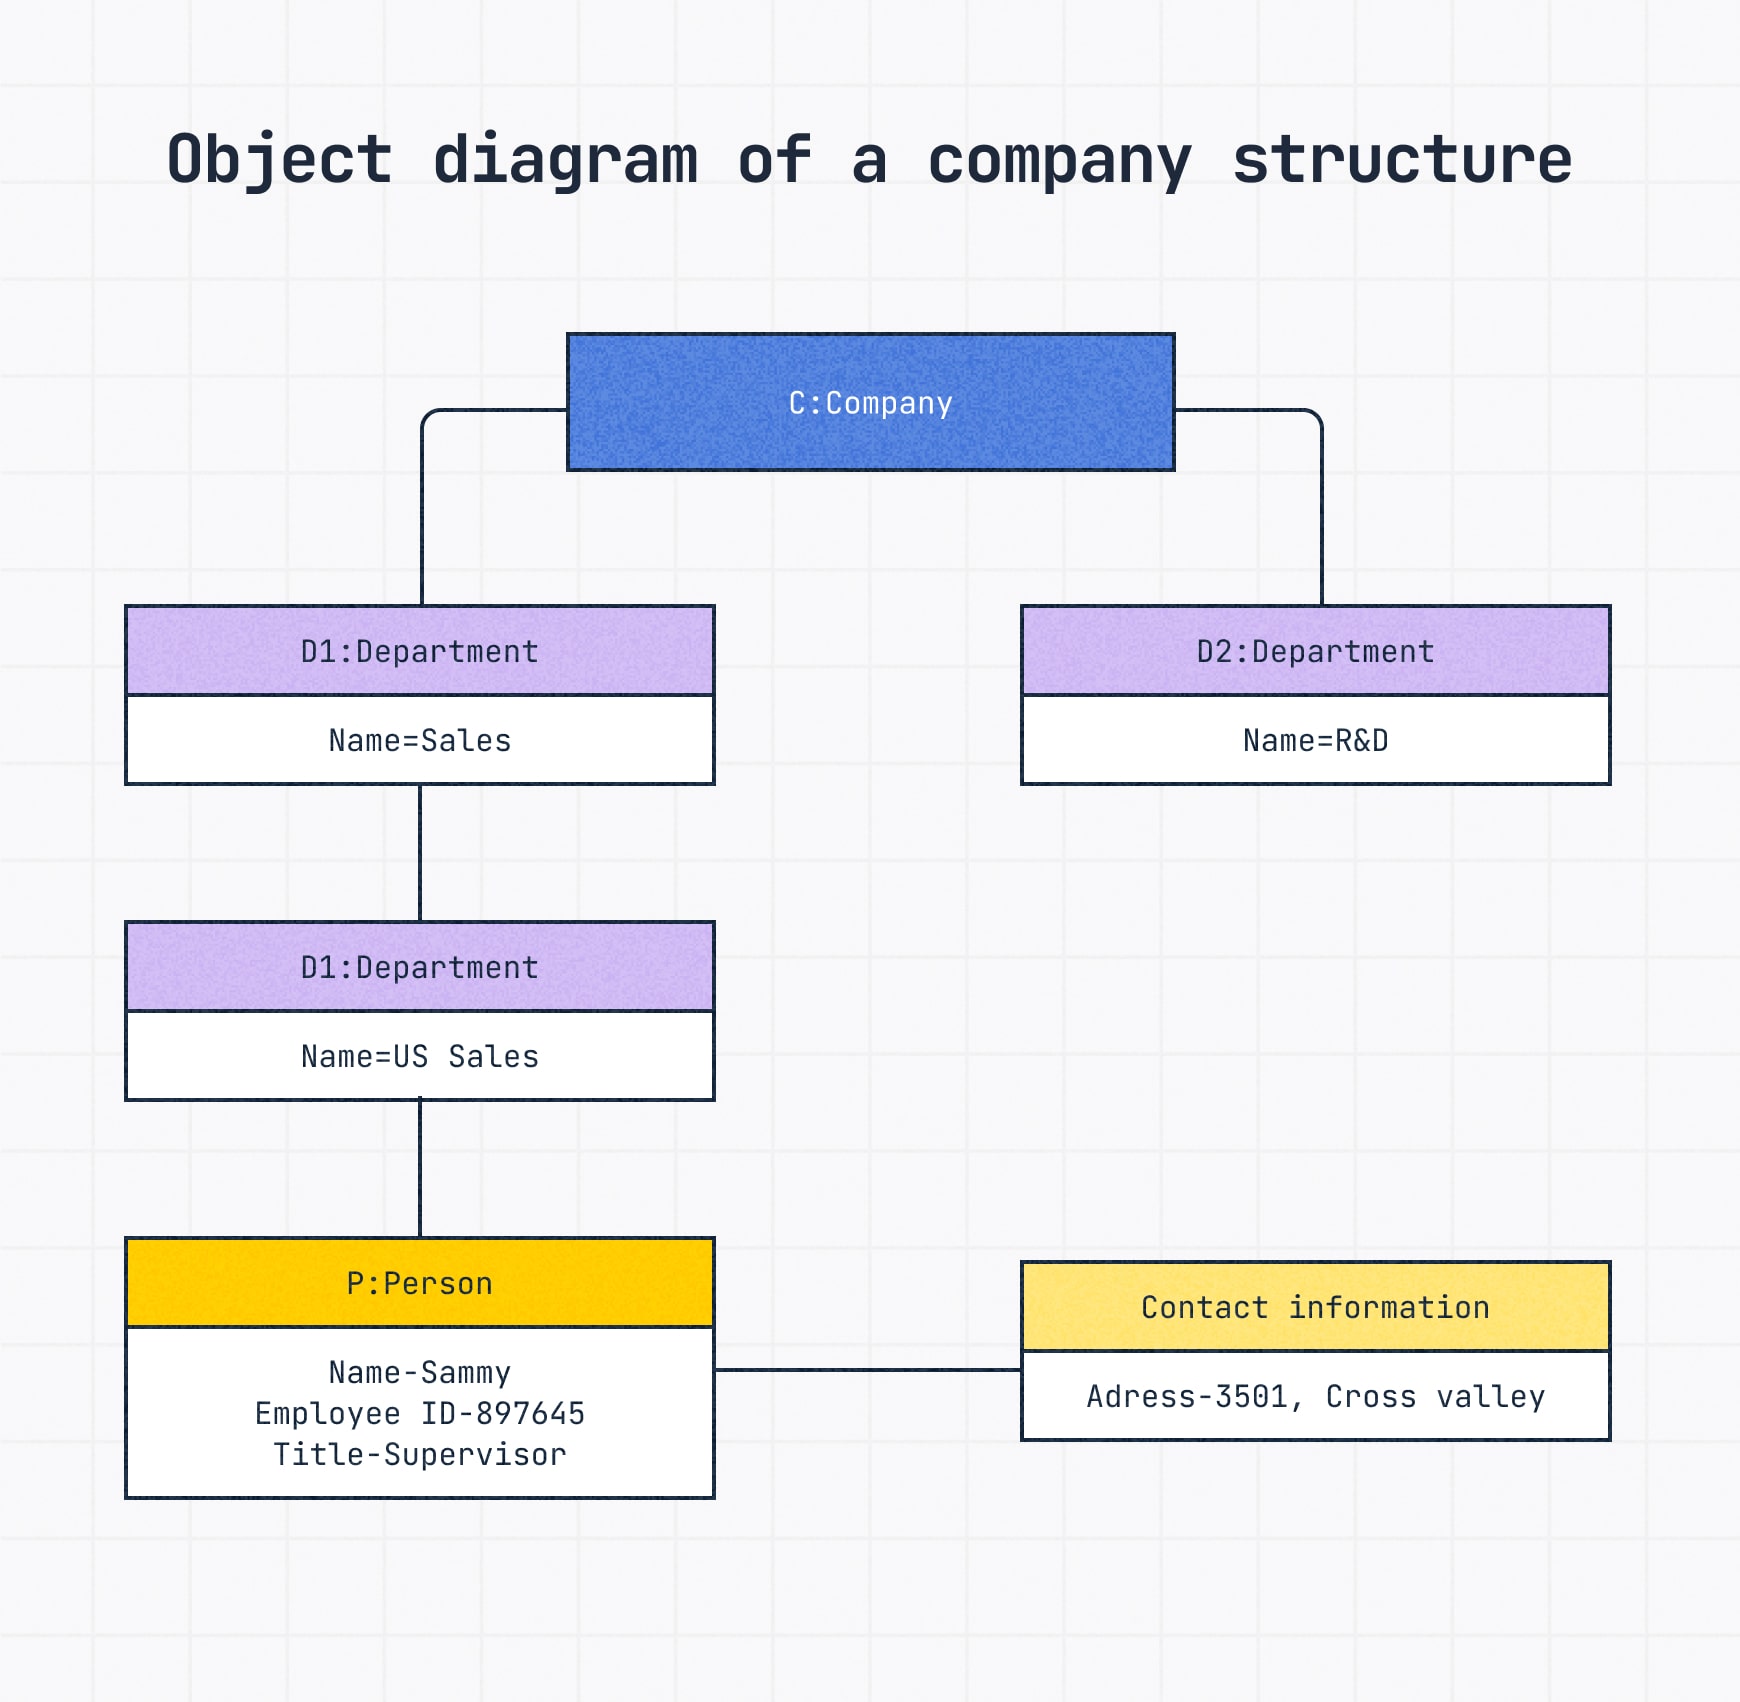
Composite structure diagram
A composite structure diagram digs deeper into the internal structure of classes and components.
It also shows the nested relationships, making it easier to model systems where one class or component contains others. Super useful for getting an understanding of complex classes or components.
Composite means something is made up of various parts or elements, after all.
Composite structure diagram example: A peek inside the server to see its main components and how they’re organized. It shows parts like the CPU, Memory, BIOS and Power Supplies connecting to the Motherboard as well as Inputs/Outputs like USB and Network connections like Ethernet.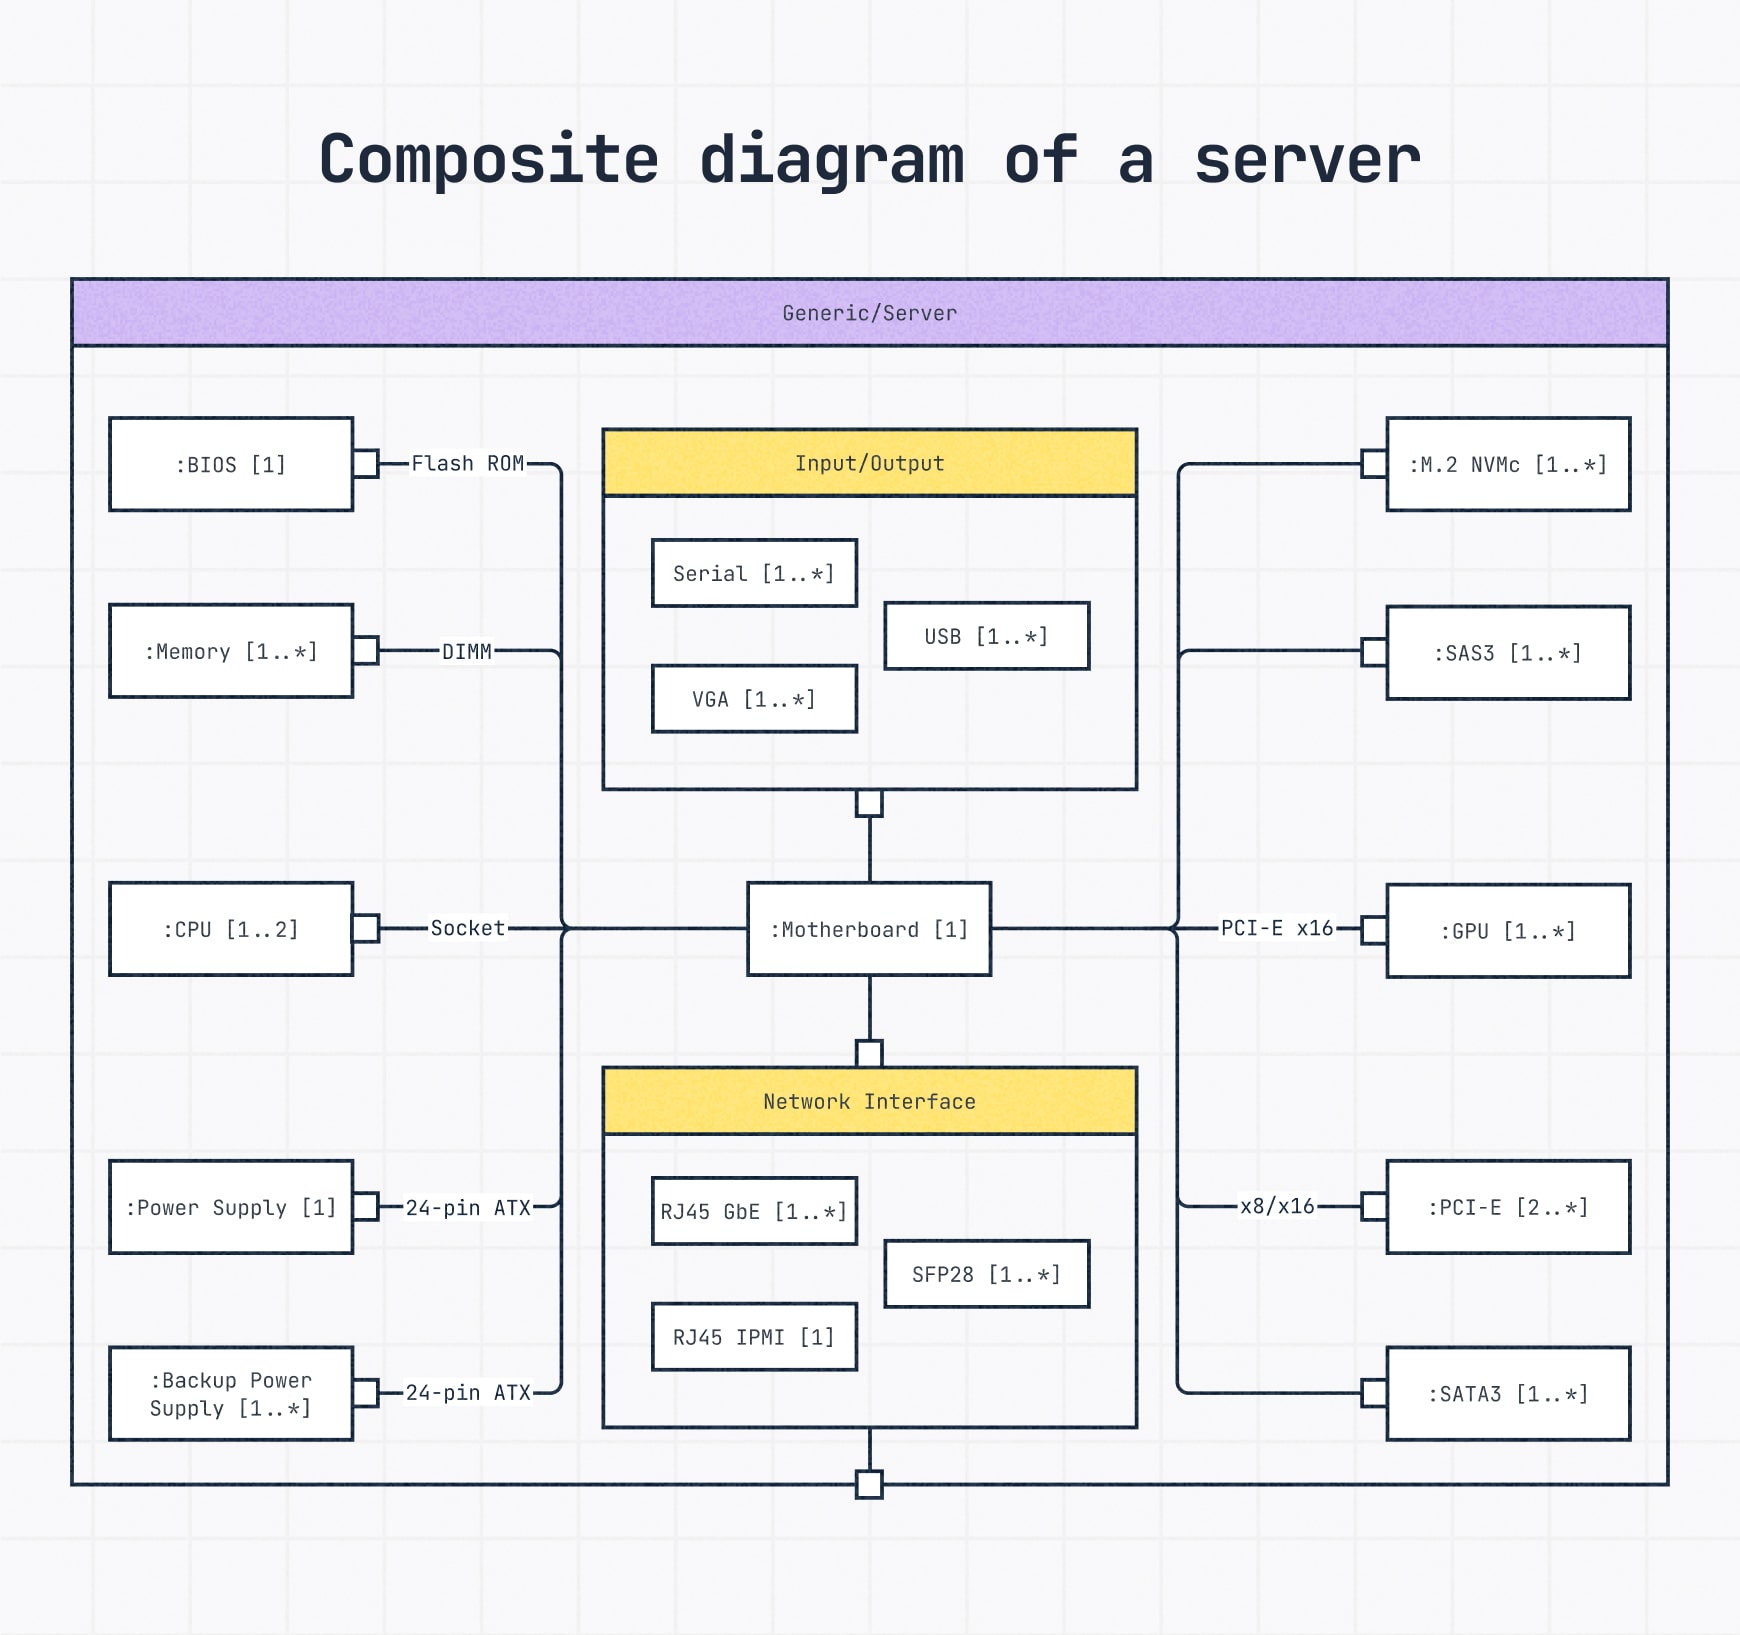
Package diagram
A package diagram groups logically related UML elements like classes, interfaces and even other packages together.
It’s like organizing your files into folders — making the overall UML model much easier to understand, navigate and manage, especially for large and more complicated systems.
By providing a higher-level view of the system’s organization and dependencies between these groups, package diagrams help all involved grasp the architecture and make it easier to collaborate across development teams working on different parts of the system.
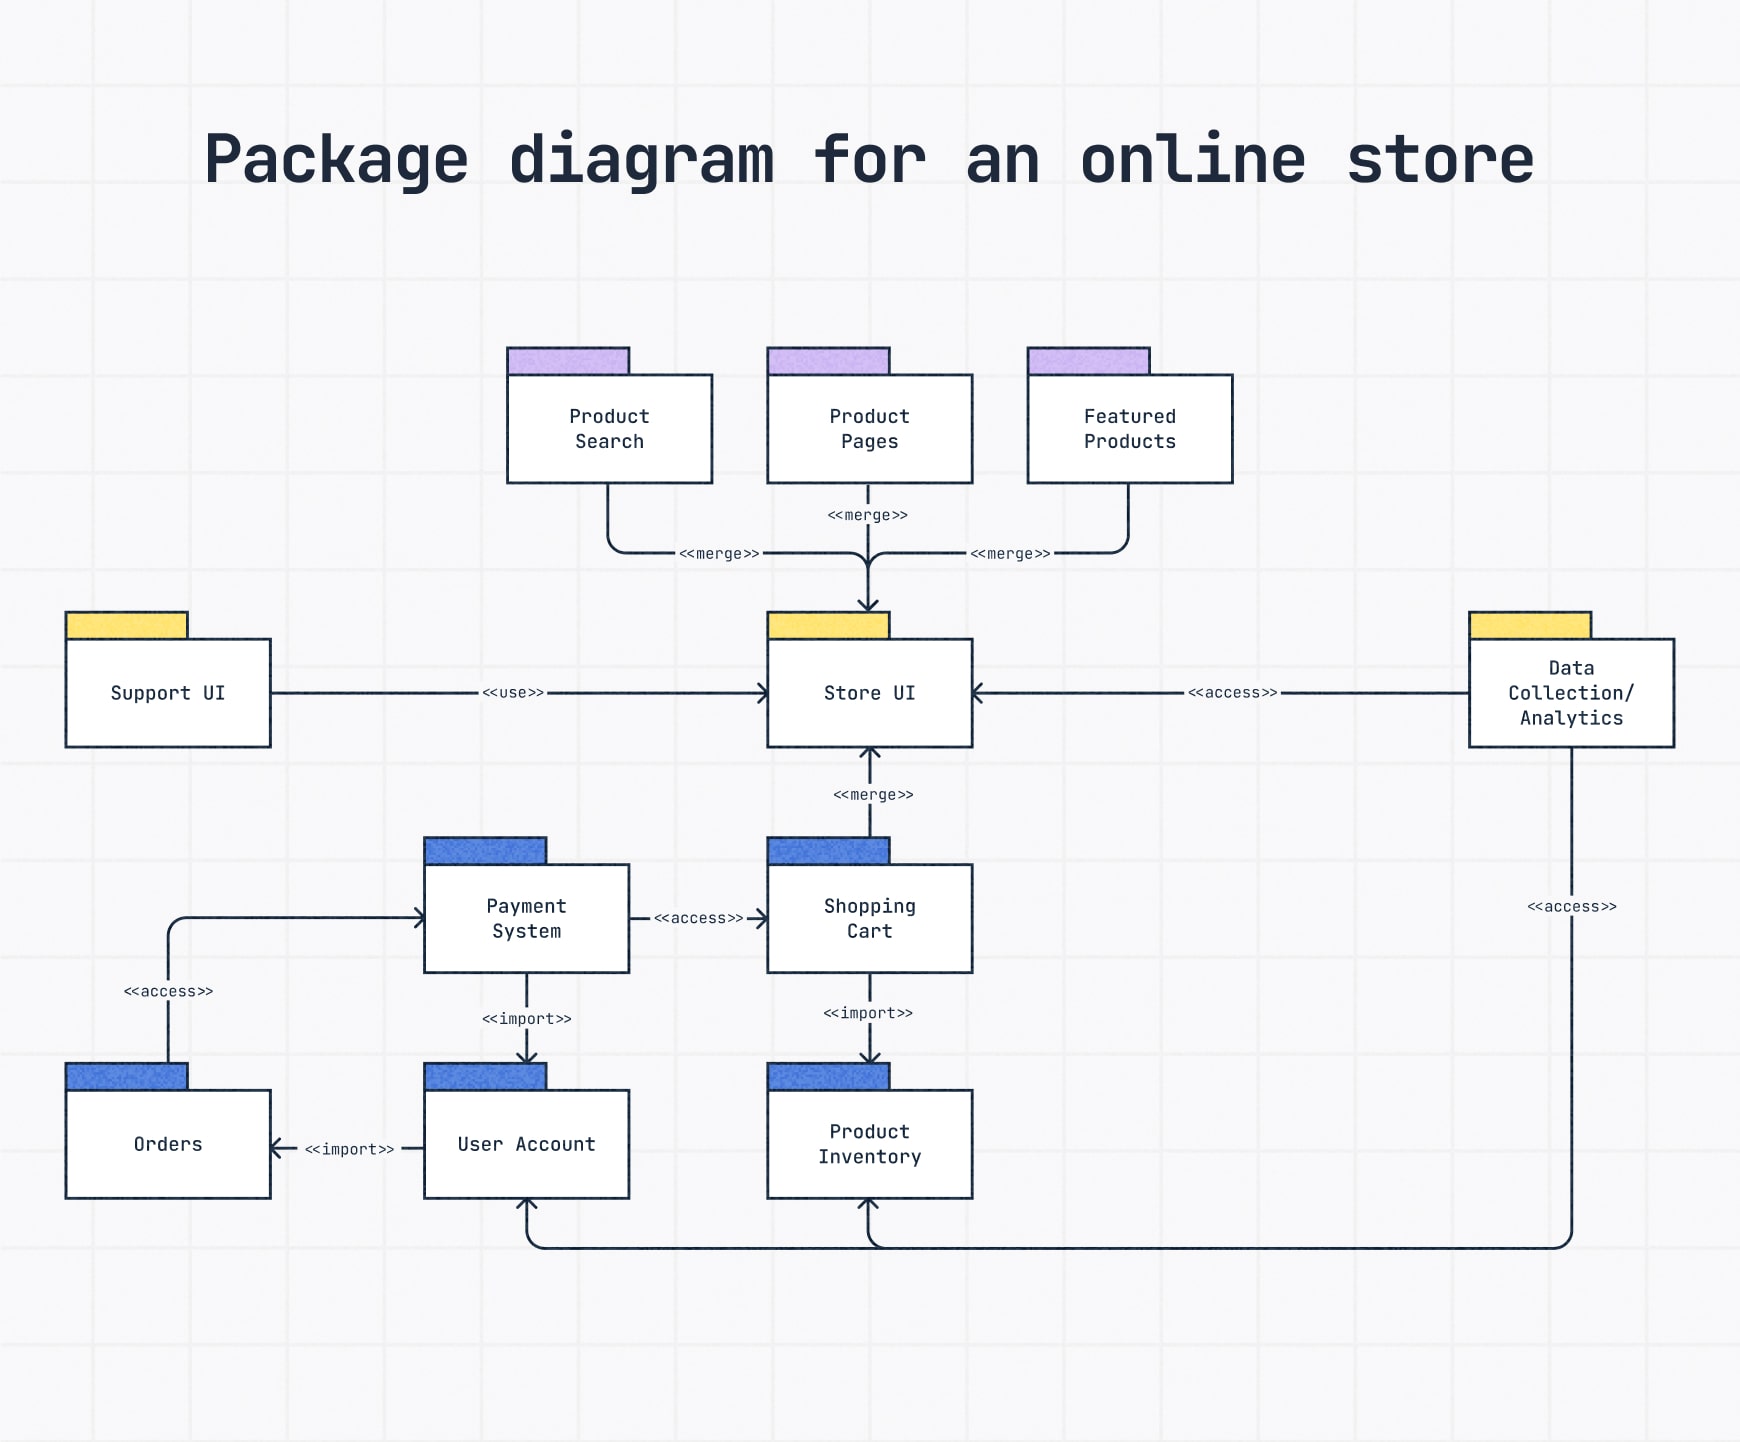
Package diagram example: An online store system organized into logical groups like Product Search, Product Pages, Store UI and Payment System.
All of these individual packages categorize related functionalities. For example, Product Search and Product Pages contribute to the Store UI. The arrows indicate dependencies, showing how one group relies on another, like the Payment System needing access to Order information.
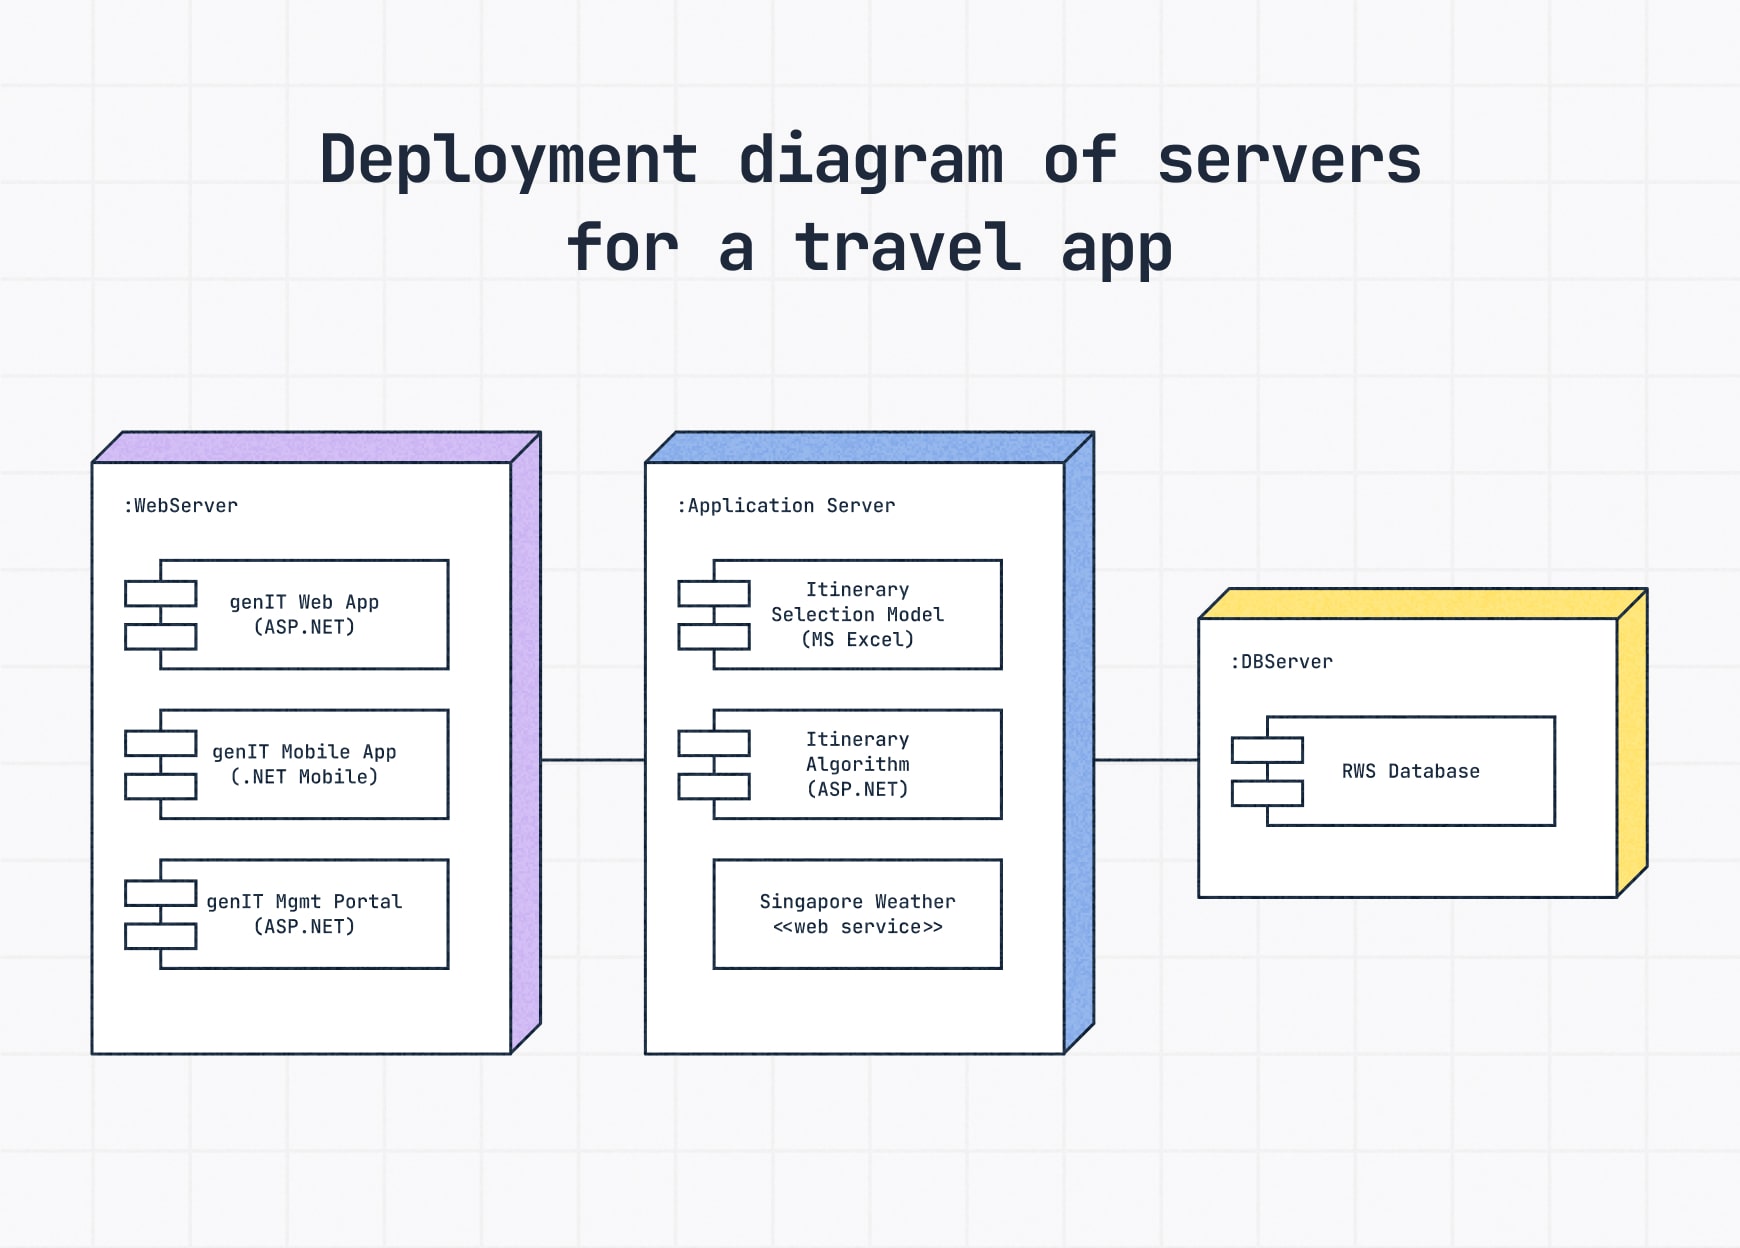
Deployment diagram
A deployment diagram shows where everything actually lives once a system is up and running. It maps out the physical components — like servers, databases and devices – and the software components deployed on them.
These diagrams come in clutch when you’re working with systems spread across multiple machines or need to show how the hardware and software connect in the real world.
If you’re diagramming a computer or telecom network, you might also want to create a network diagram to see how each component is connected.
Deployment diagram example: Mapping out the setup for a travel app. You’ve got a WebServer hosting the website and mobile app. The Application Server handles the backend logic, like itinerary planning. And a DBServer houses the database. It shows how these servers connect to make the whole system run.
Behavioral UML diagrams
Behavioral diagrams show how parts of a system interact and evolve.
They capture movement, logic and user behavior; the dynamic stuff structural diagrams don’t cover.
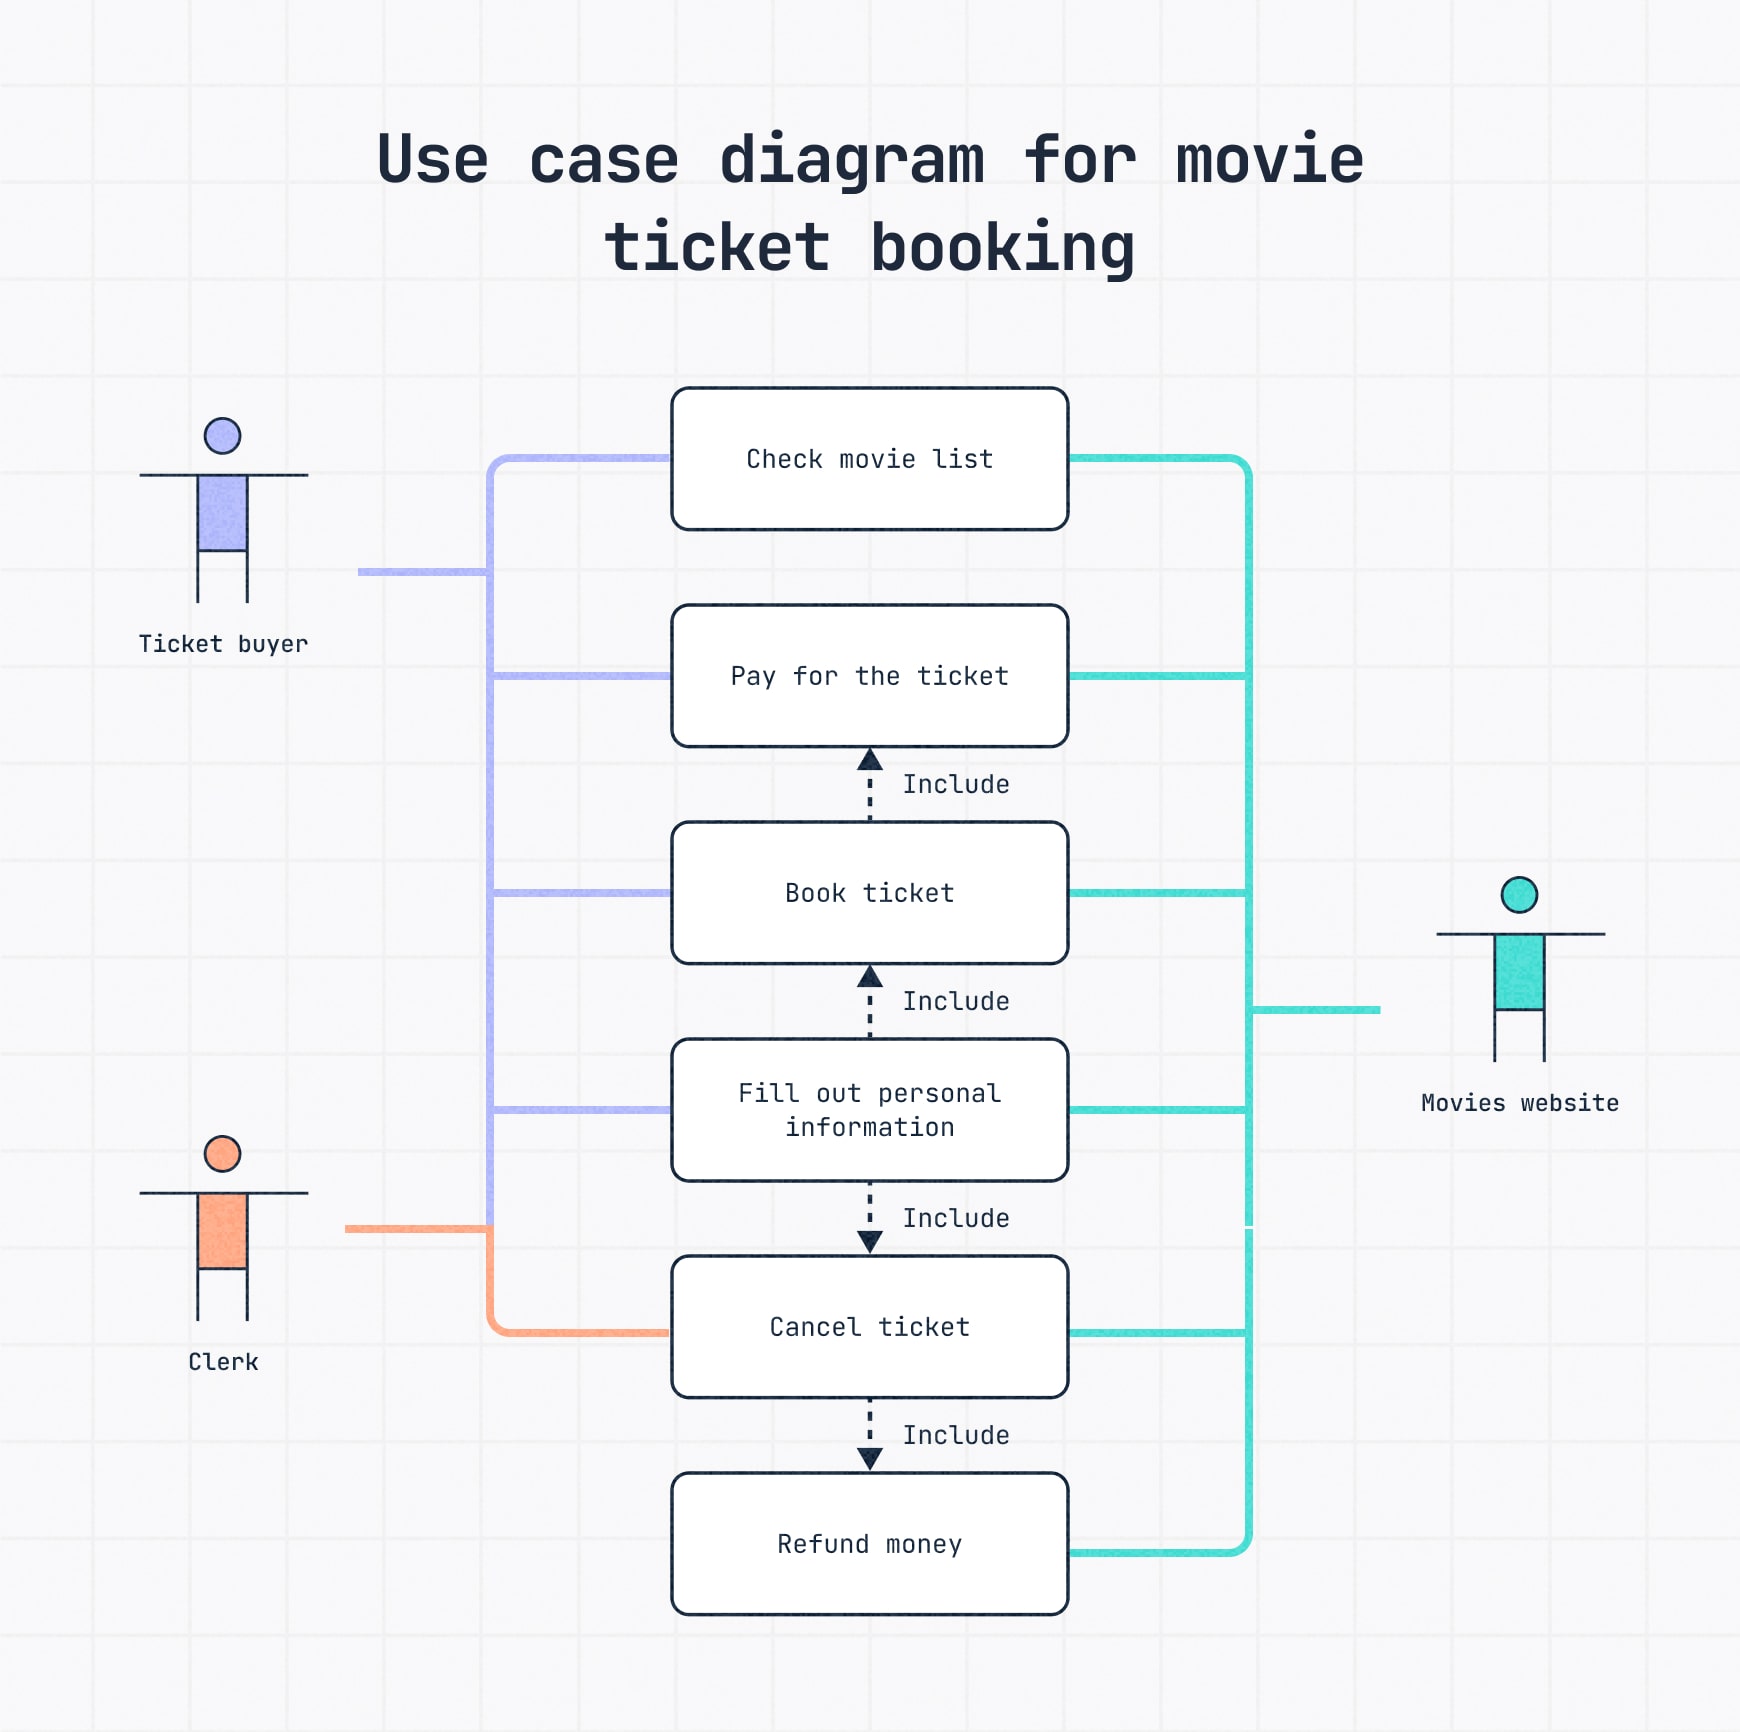
Use case diagram
A use case diagram maps out what users, known as "actorsv in these diagrams, can do within a system.
It focuses on the functionalities, i.e., use cases, that the system can handle and how various users interact with them. Great for high-level planning before you dive into specifics.
Use case diagram example: Here’s a basic use case diagram for a movie theater’s website. The site can do everything listed, so all lines go to it.
A Ticket buyer can check listings, pay and book tickets and fill in their info. A Clerk can cancel tickets, which might involve a refund. Those are the key actions users and staff can take on the site.
Free use case diagram template
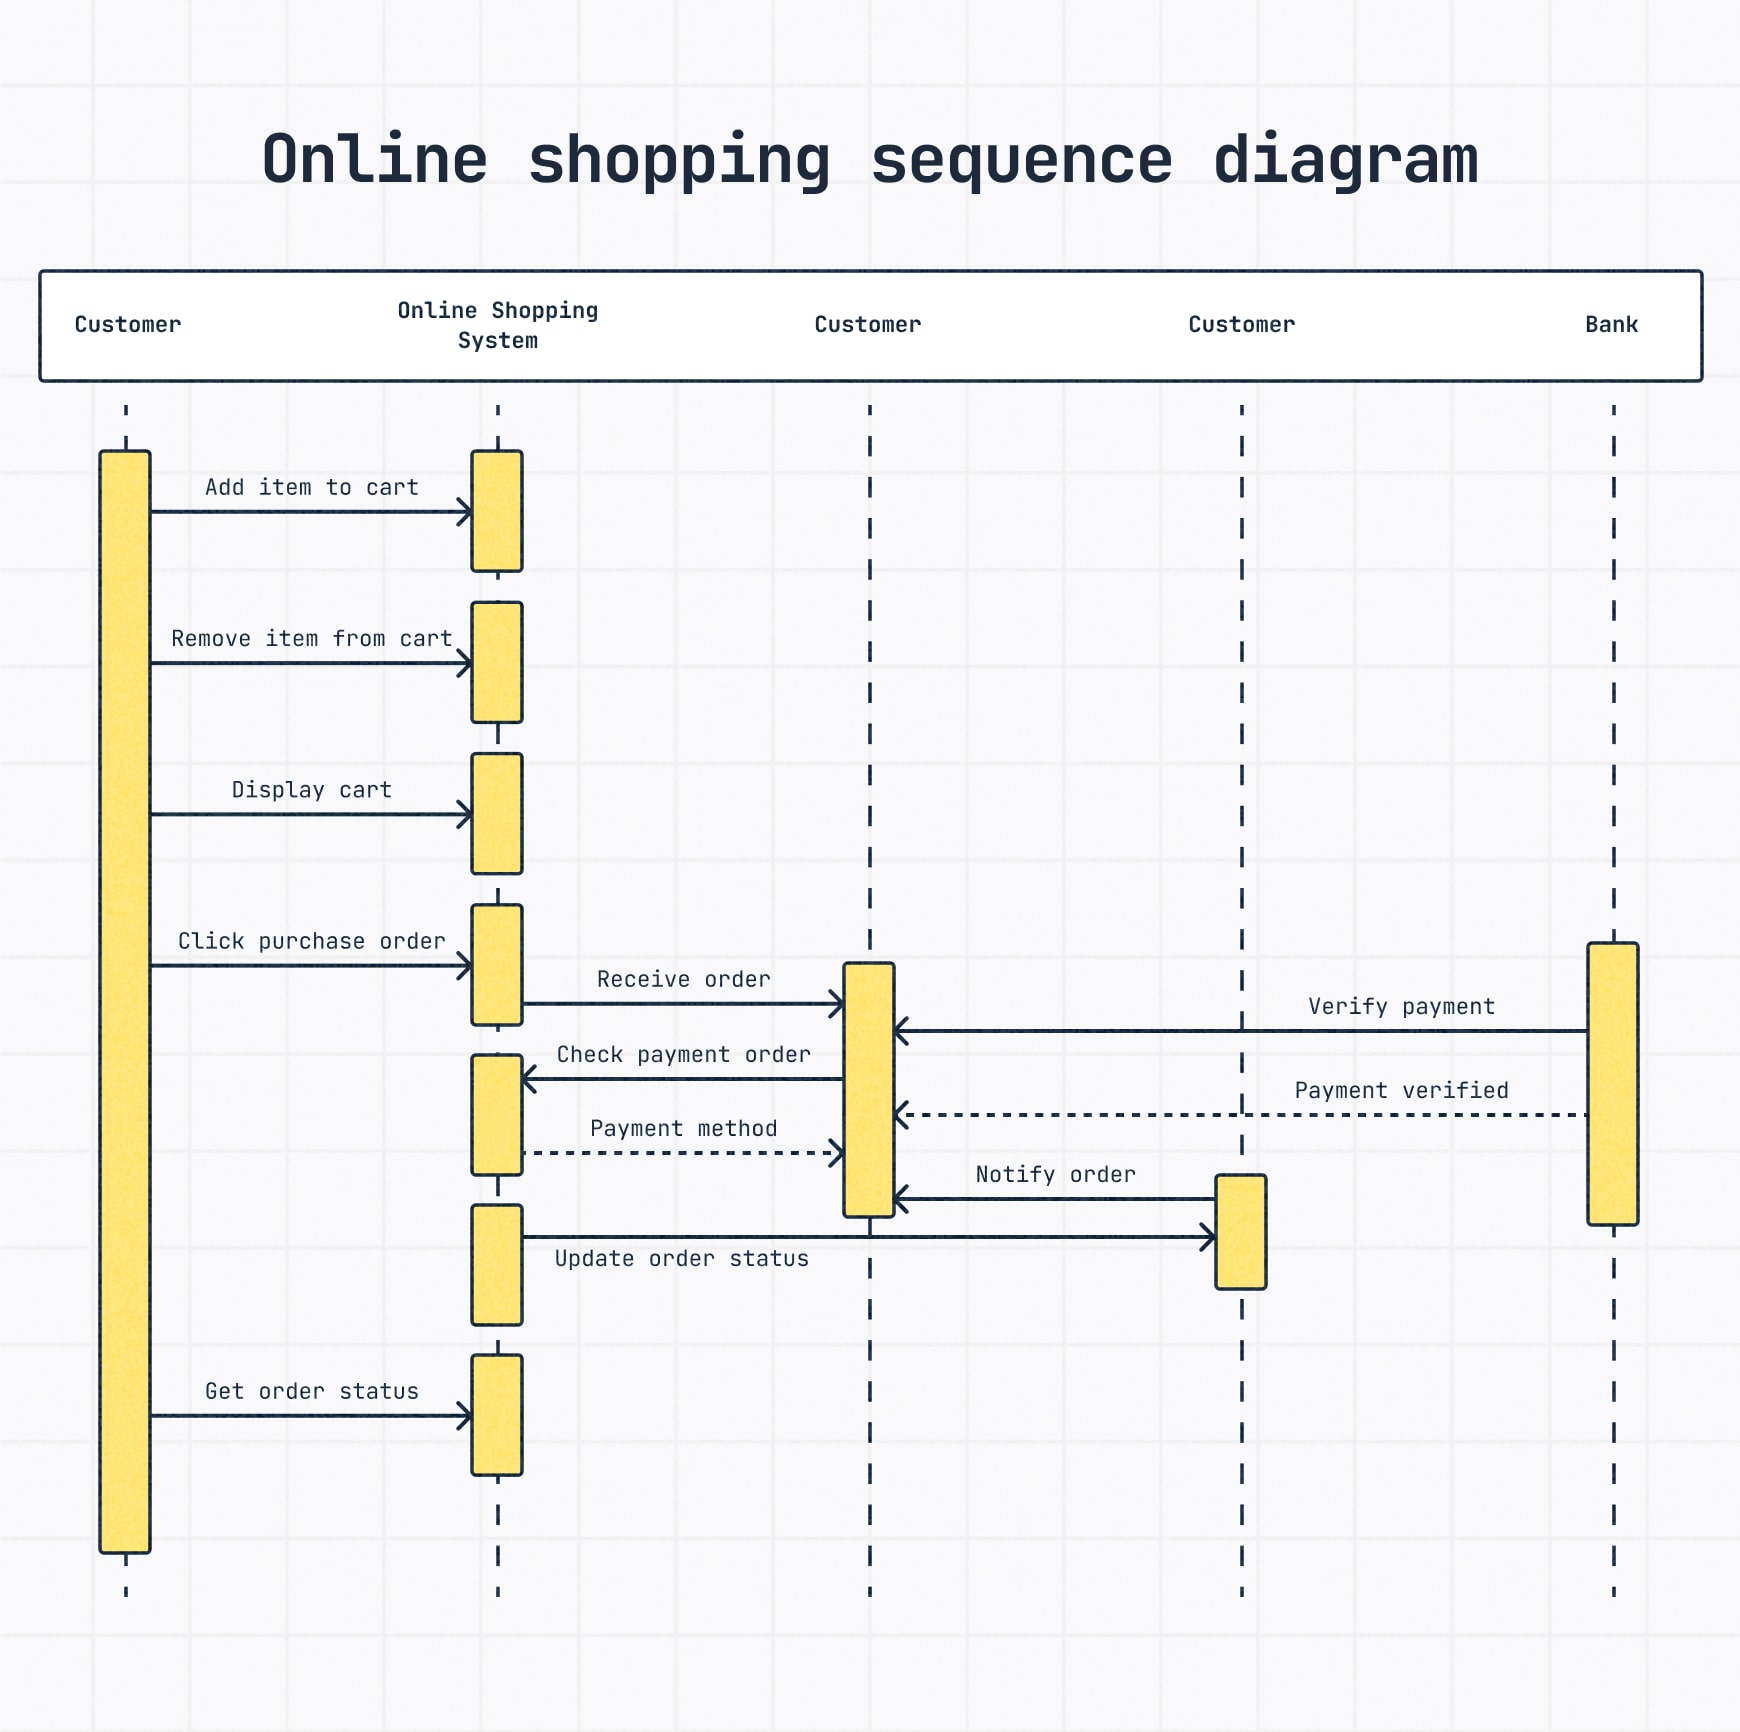
Sequence diagram
A UML sequence diagram describes how objects or components interact over time to complete a process.
It’s about dynamic behavior, showing the exact order of operations and the messages passed between parts of the system, step-by-step.
When time and order of operations are imperative, these diagrams visualize that back-and-forth flow really well.
Sequence diagram example: There’s a clear order involved in making an online purchase. Here we see all the steps the customer takes before the online shipping system and bank get involved, as well as the communication between all parties.
A customer adds an item to a cart, places an order, and the system checks the payment with the bank. Once payment is verified, the system updates the order status and sends confirmation back to the customer.
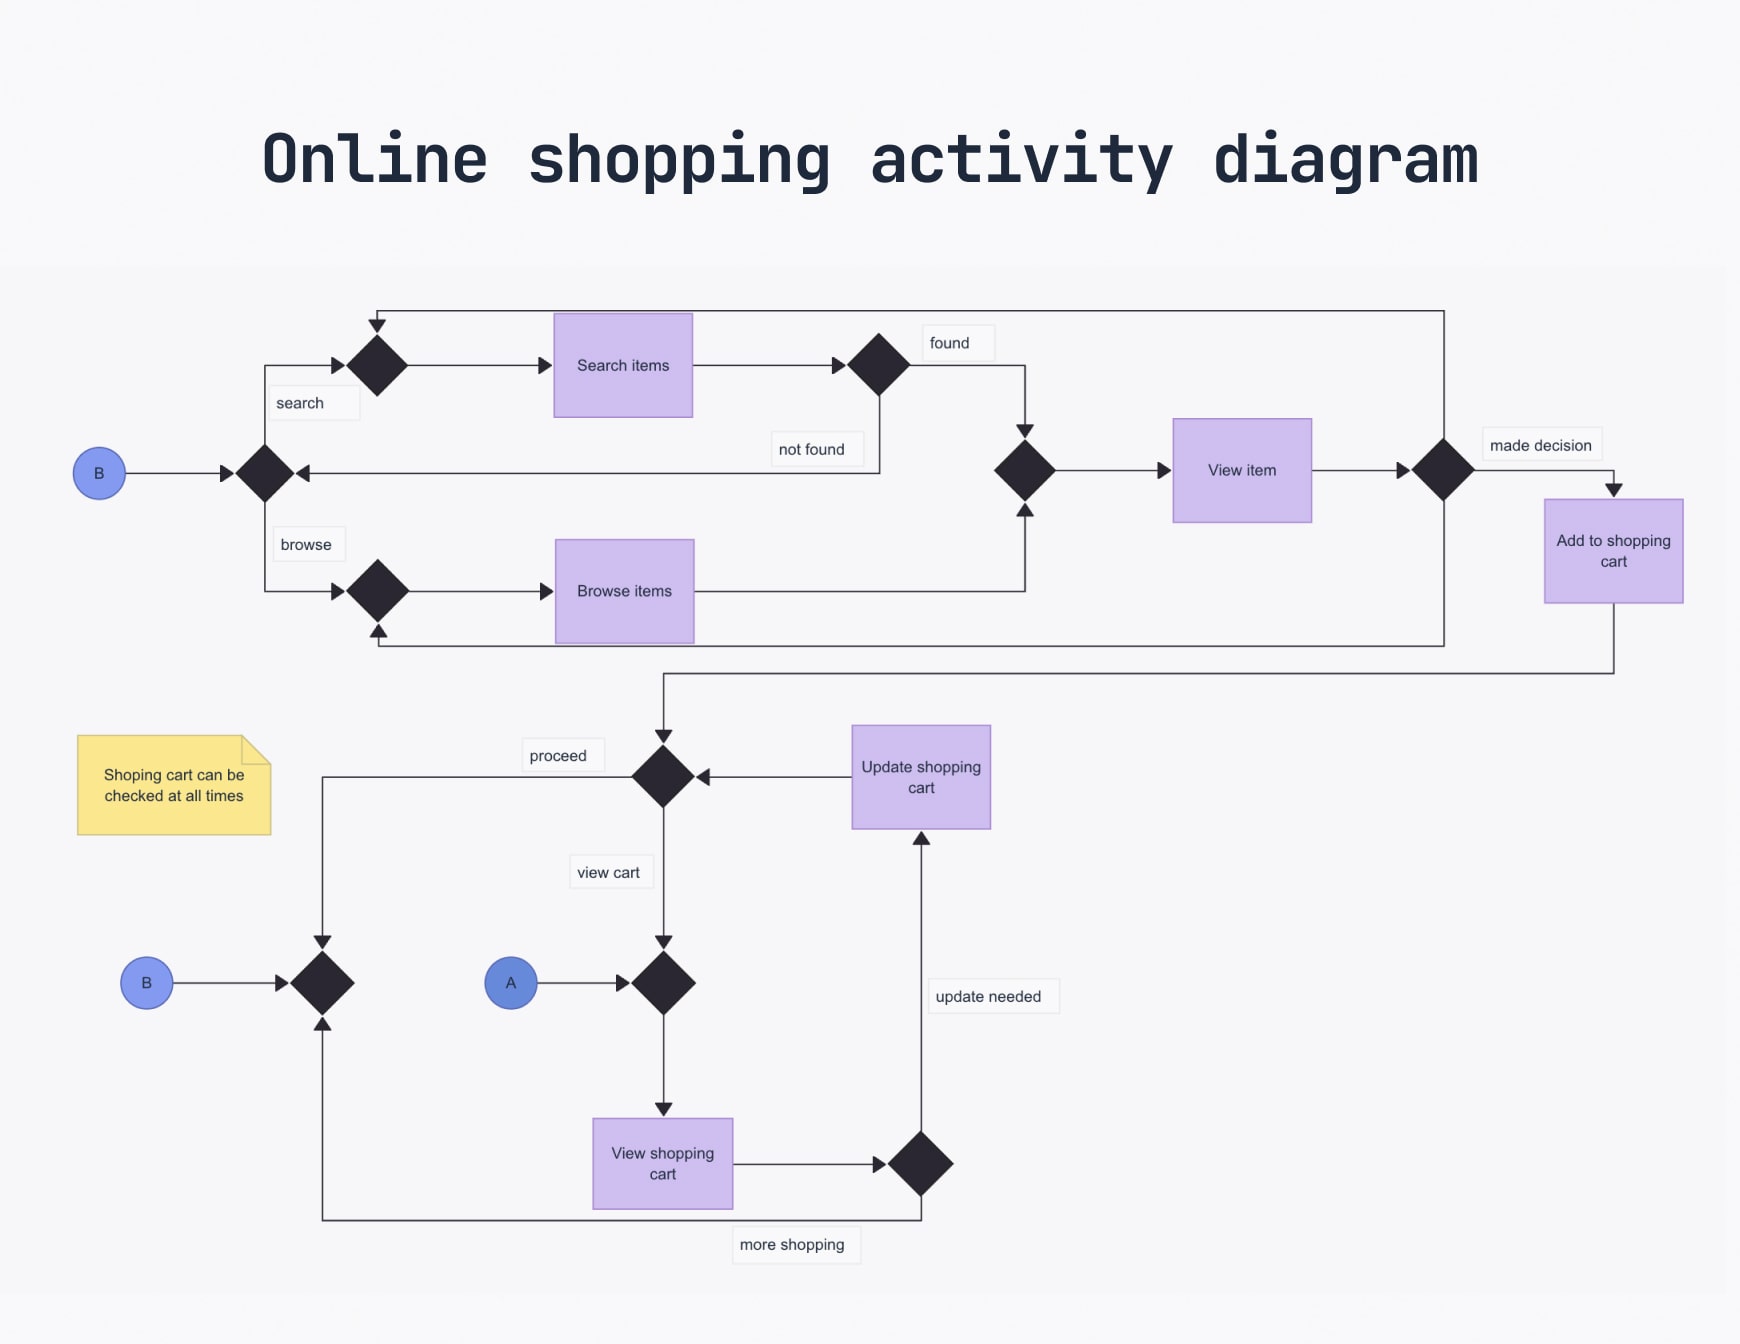
Activity diagram
An activity diagram looks a lot like a flowchart. It maps out a process flow — basically, the steps or activities that need to happen to complete a task. Consider it a UML-specific version of a flowchart, sticking to standard symbols and structure.
If you’re modeling business workflows or user experiences, an activity diagram clearly illustrates the entire process from start to finish.
Activity diagram example: A customer explores an online store by searching or browsing items. If they find something they like, they view the product details and decide whether to add it to their cart. At any point, they can check or update their cart, then continue shopping or proceed to checkout.
Free activity diagram template
Communication diagram
Communication diagrams focus on the object interactions that make a process happen. If you’re a UML pro, you’ll recognize these as collaboration diagrams, which is what they used to be called.
They show the relationships and messaging between objects — similar to sequence diagrams, but they emphasize the "who’s talking to who" part more than just the timeline.
Communication diagrams focus on that dialogue, which is shown sequentially with numbers.
Communication diagram example: In an online shopping system, a customer searches for products in the Web Store (1), which communicates with the Product Inventory to show available items (1.1). If the customer decides to buy, the Product sends a message to the Shopping Cart to add the item (1.2).
If they change their mind (2), the cart updates the Product listing. When the customer places an order (1.3), the Shopping Cart communicates with the Order system to process it, which then (1.4a) records the order in User Order History and (1.4b) sends an Order Confirmation email.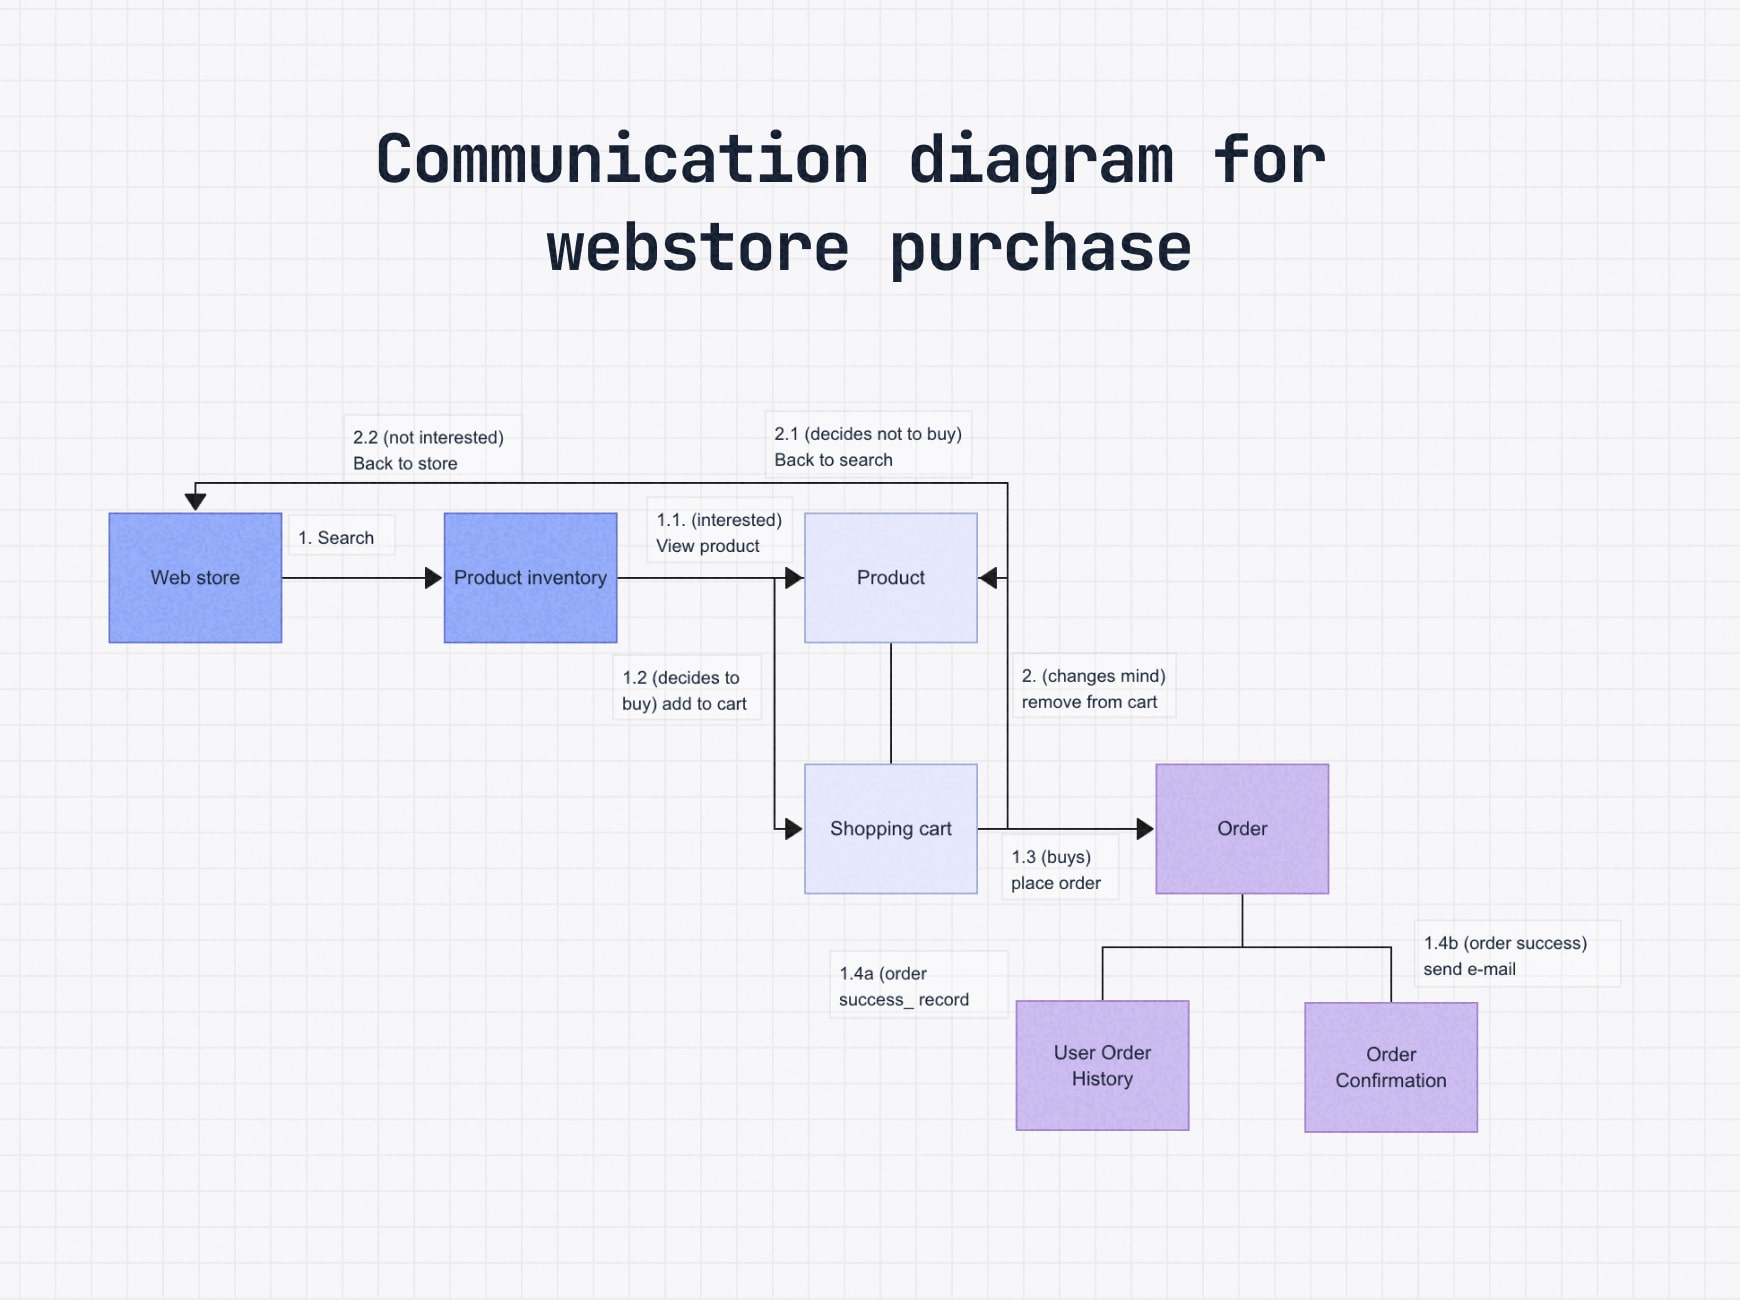
Free communication diagram template
Interaction overview diagram
An interaction overview diagram gives a high-level overview of the interactions in a system or process, like a zoomed-out storyboard of interactions.
It blends elements of activity diagrams, like decisions and flow, with references to other interaction diagrams, such as sequences or communications, keeping the focus on the big picture.
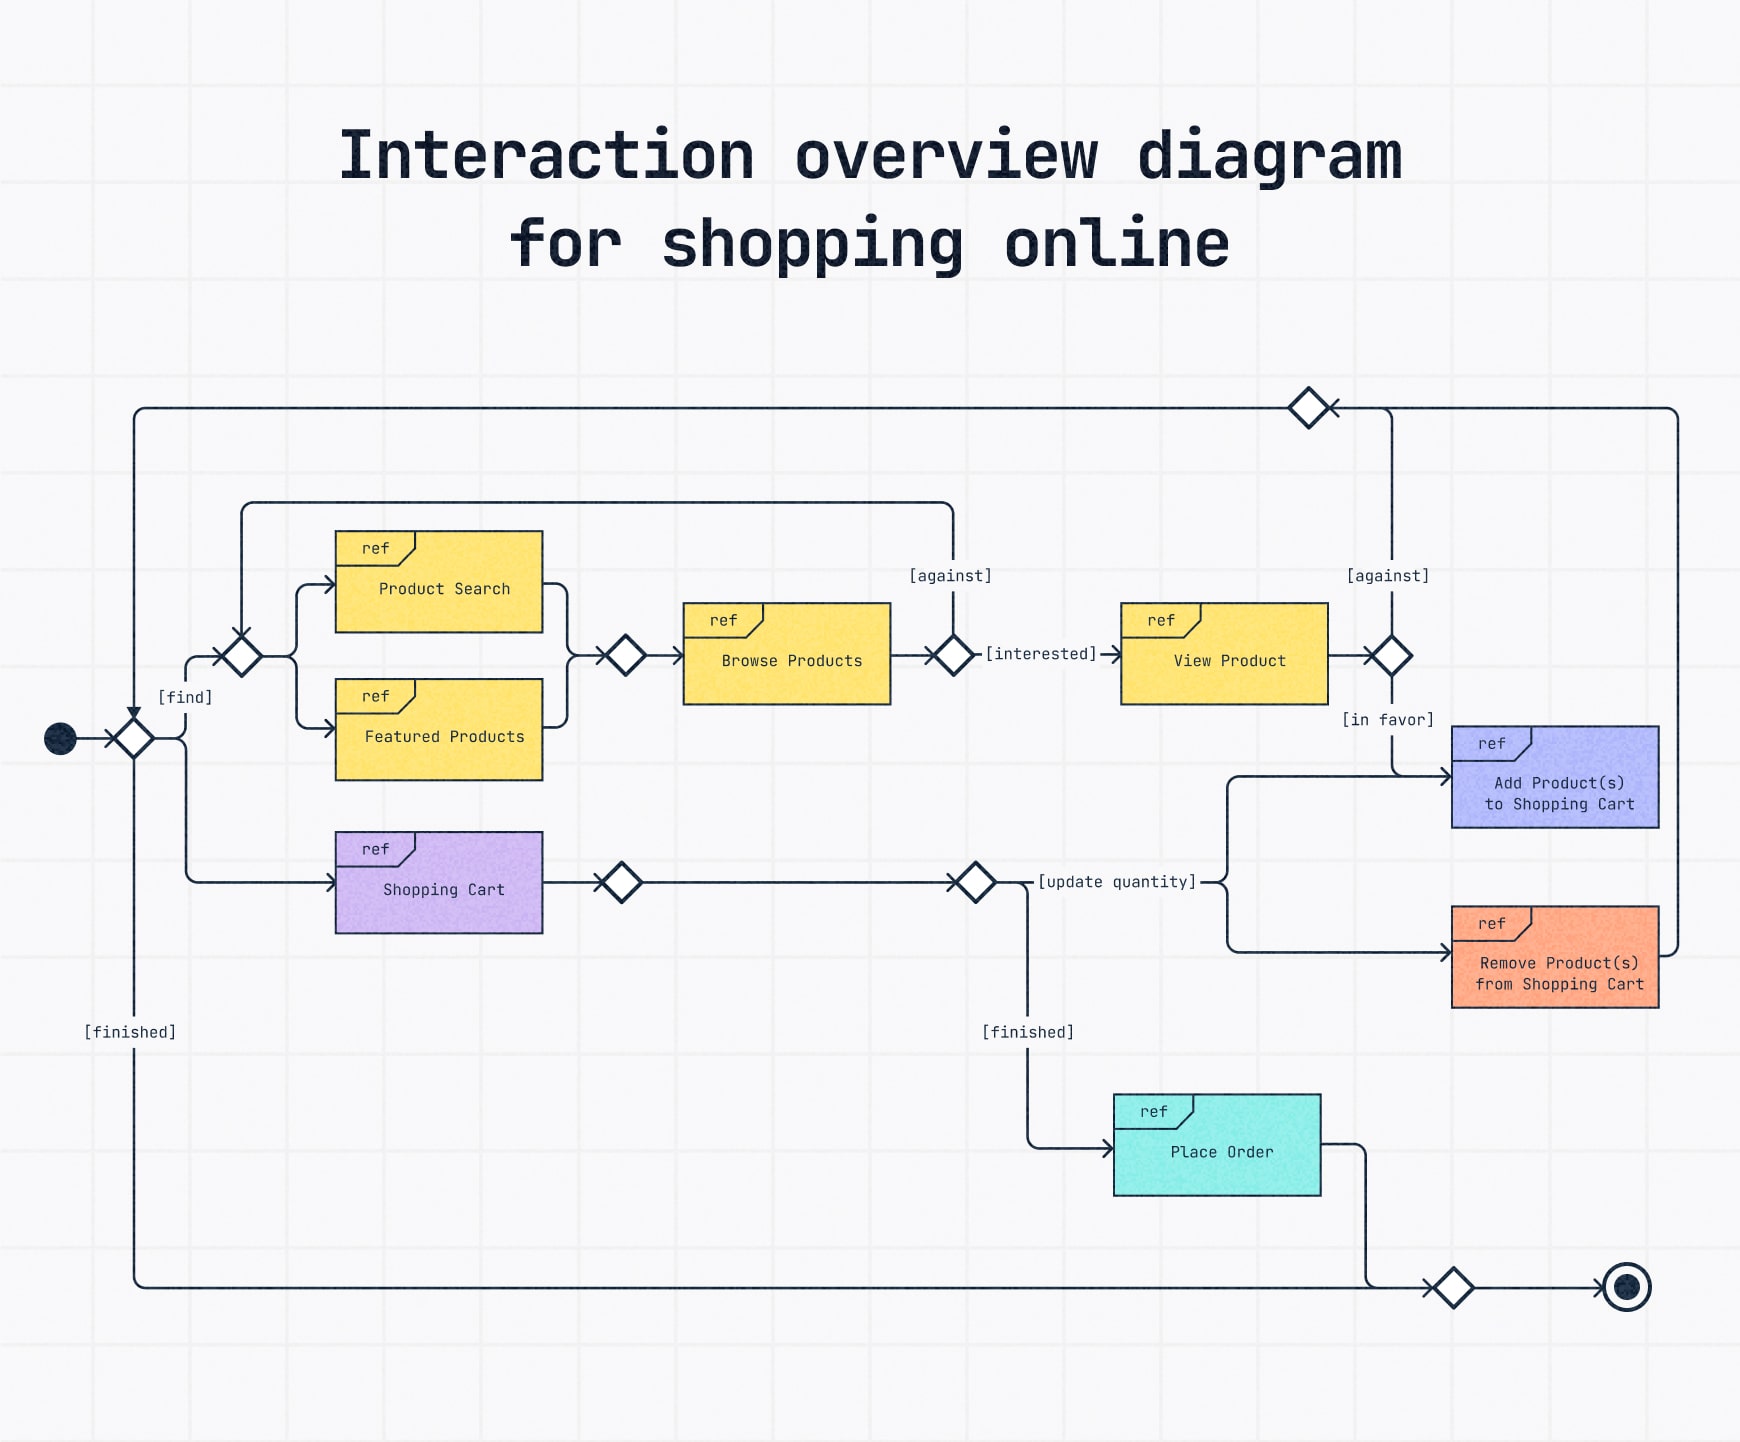
Interaction overview diagram example: A customer explores an online store by searching, browsing products, viewing items and adding or removing them from the cart. Once ready, they place an order. Each step in the diagram points to a more detailed interaction, making it easier to understand the full process without overwhelming detail.
State machine diagram
A state machine diagram (sometimes called a statechart diagram) shows how an object changes states over time based on different events.
It’s perfect for modeling systems with defined stages, like a user account moving from "Pending" to "Active," "Suspended," or "Deactivated."
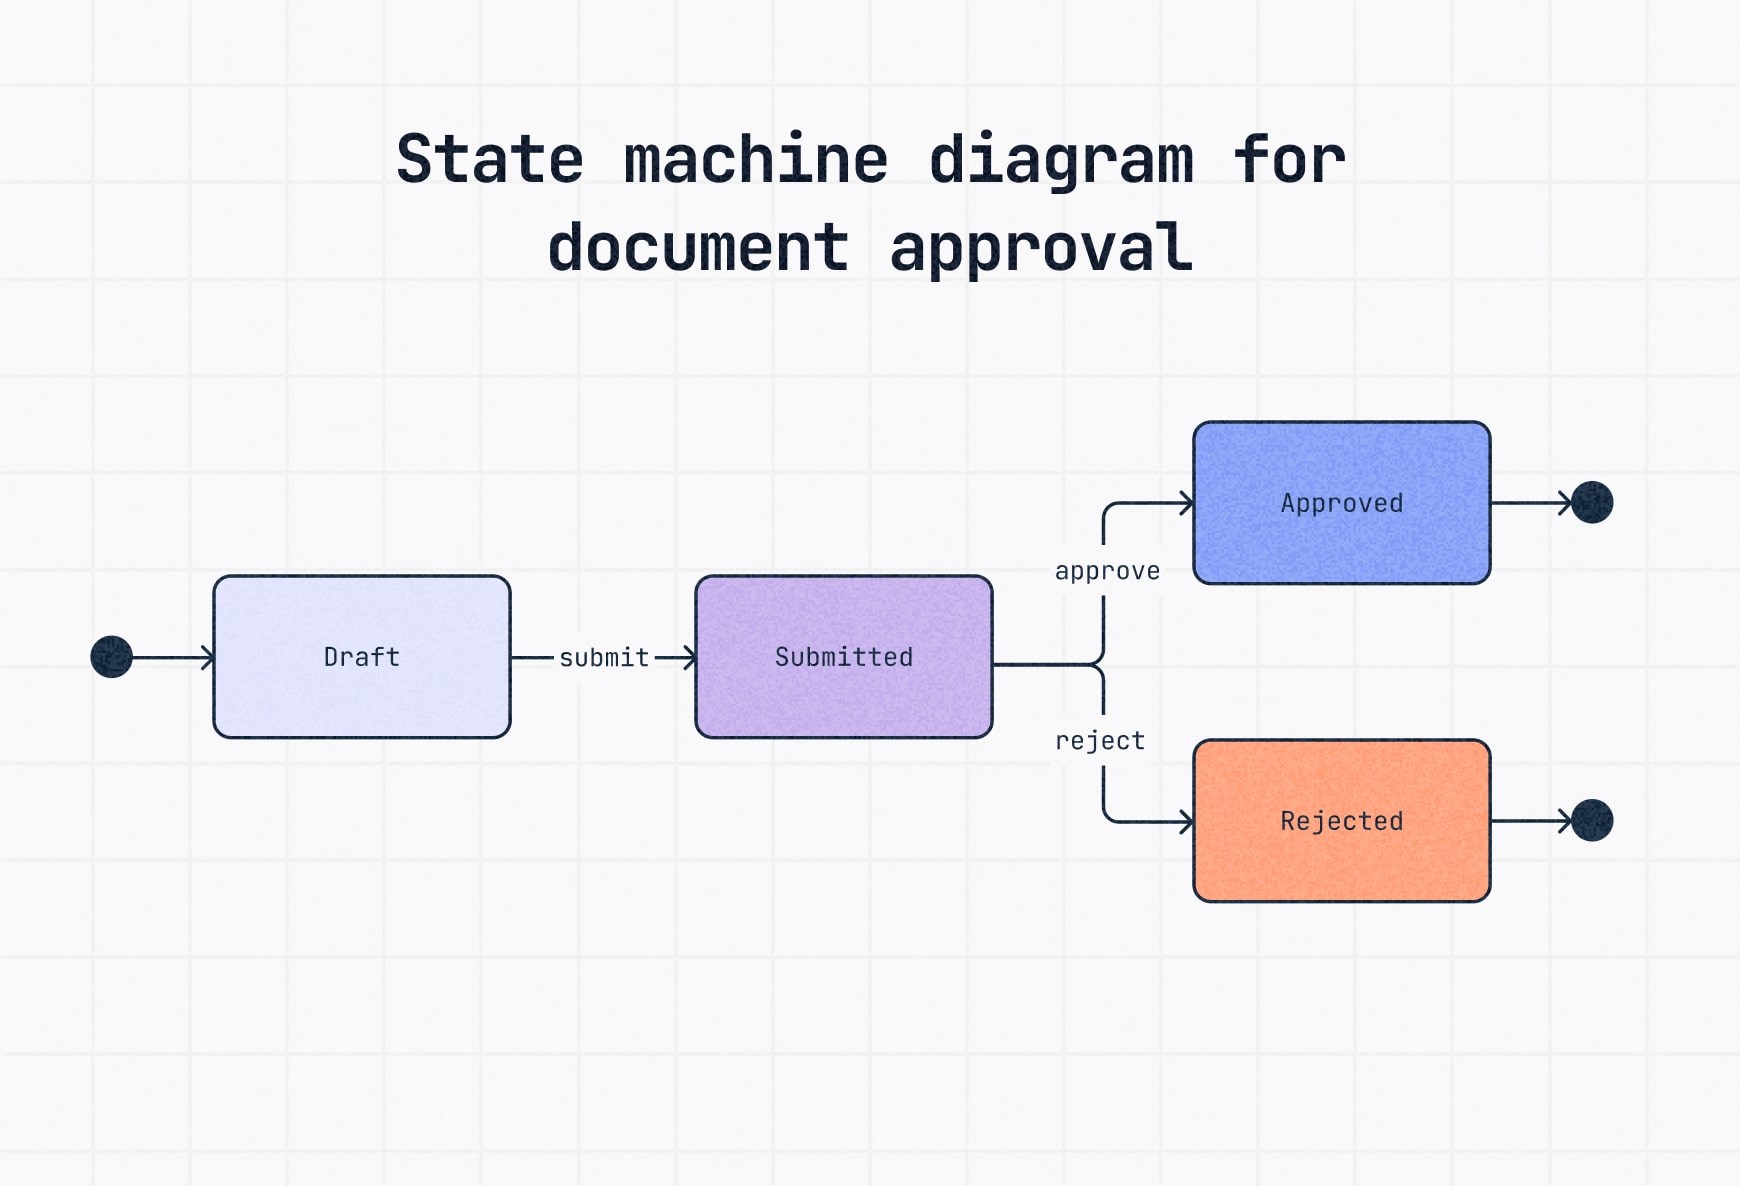
State machine diagram example: A document approval system where a file moves from Draft → Submitted → Reviewed → either Approved or Rejected, depending on the review outcome.
Want to see how Slickplan simplifies diagramming with your team? Check out this 1-minute video.
Benefits of using UML diagrams
UML diagrams aren’t just nice visuals, they’re powerful tools that make complex work easier to design, understand, and manage.
They’ve been around for decades — and with good reason. UML remains one of the best ways to map out complicated systems clearly, especially at scale.
Here’s why using UML diagrams pays off:
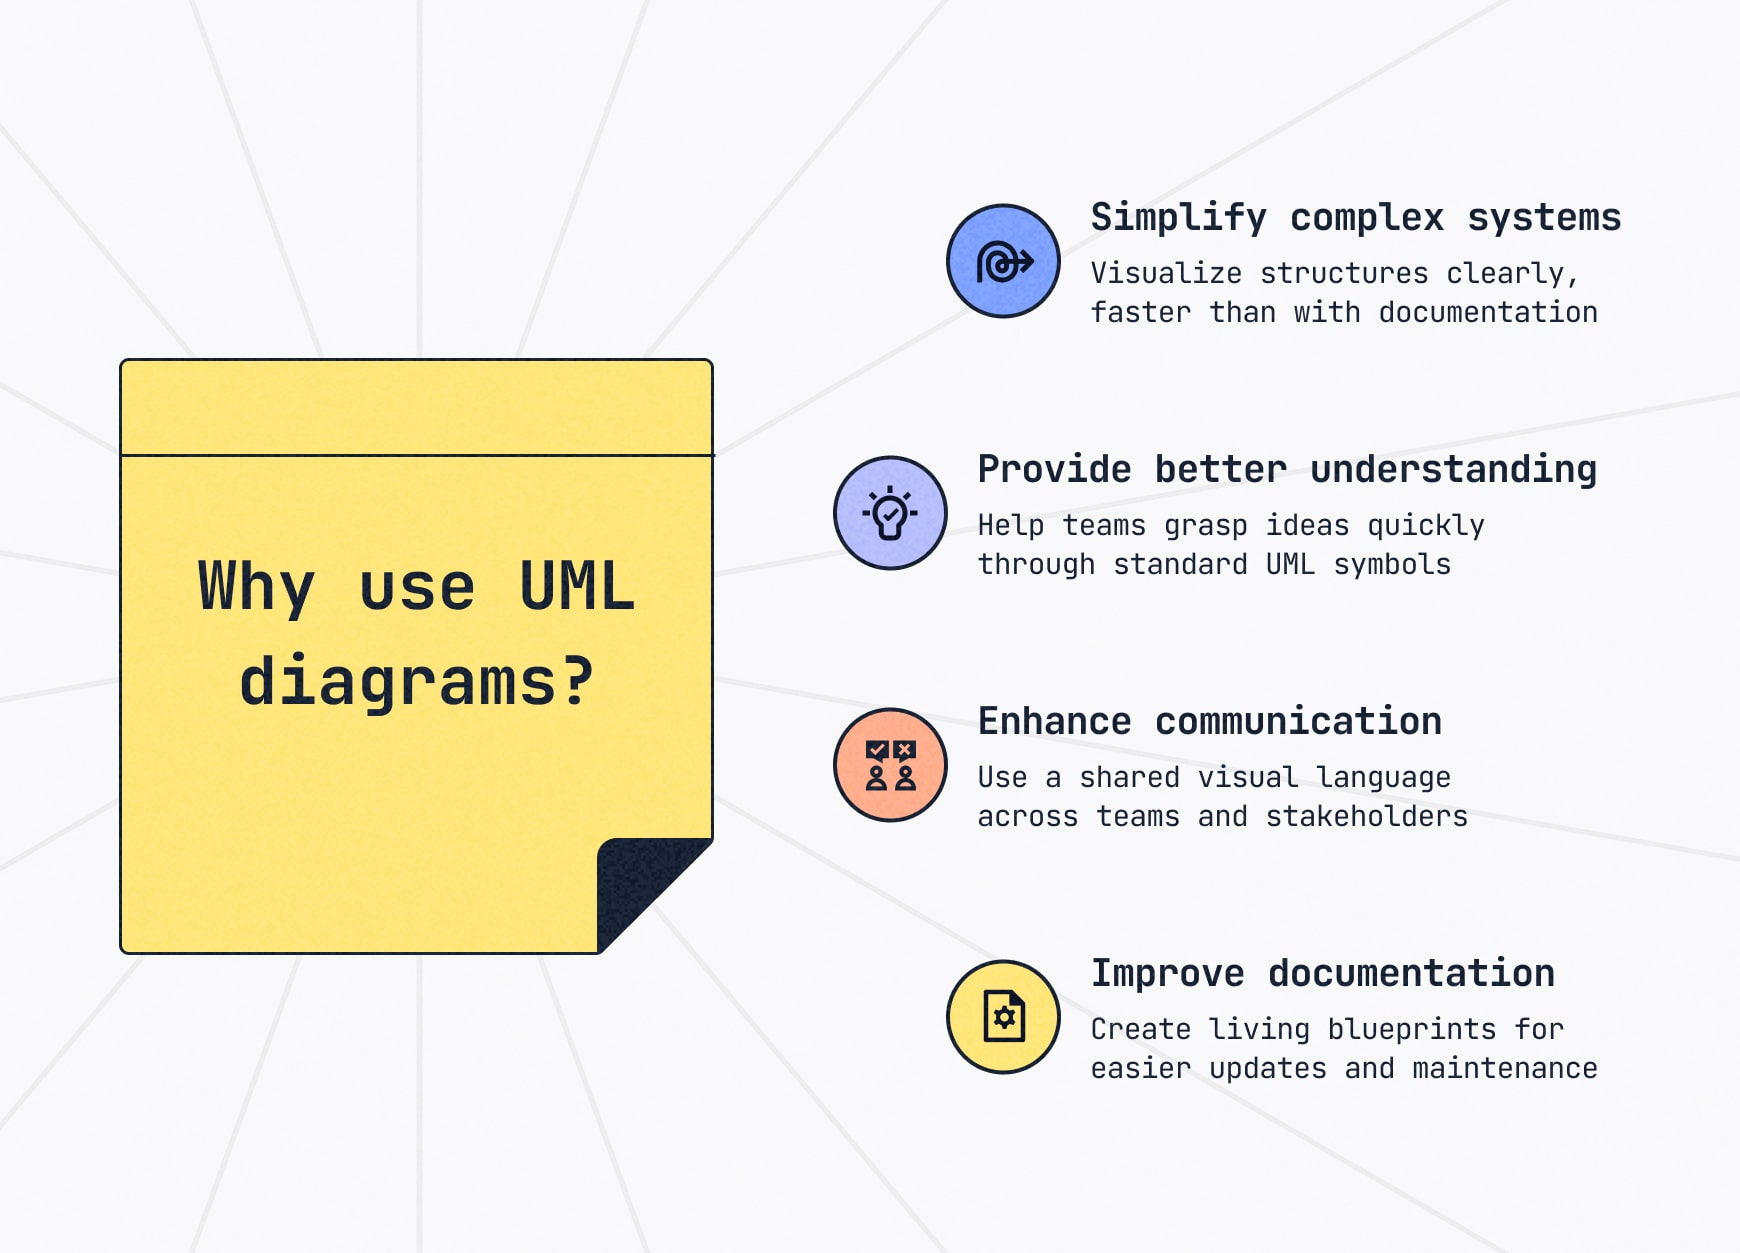
Simplify complex systems
Instead of endless documentation, a UML diagram lays out the system visually, helping teams spot problems and opportunities faster.
Provide better understanding
People process visuals much faster than text. A well-built diagram using standard UML symbols cuts through confusion, aligns teams and speeds up decision-making.
Enhance communication
UML gives developers, software engineers and stakeholders a shared visual language, making it easier to explain systems, gather feedback and stay on the same page as projects evolve.
Improve documentation
Good UML diagrams serve as living blueprints. They make documenting functional requirements, system models and future updates faster, easier and more reliably.
How to make a UML diagram
You don’t need to be a UML expert to build one, you just need a solid process.
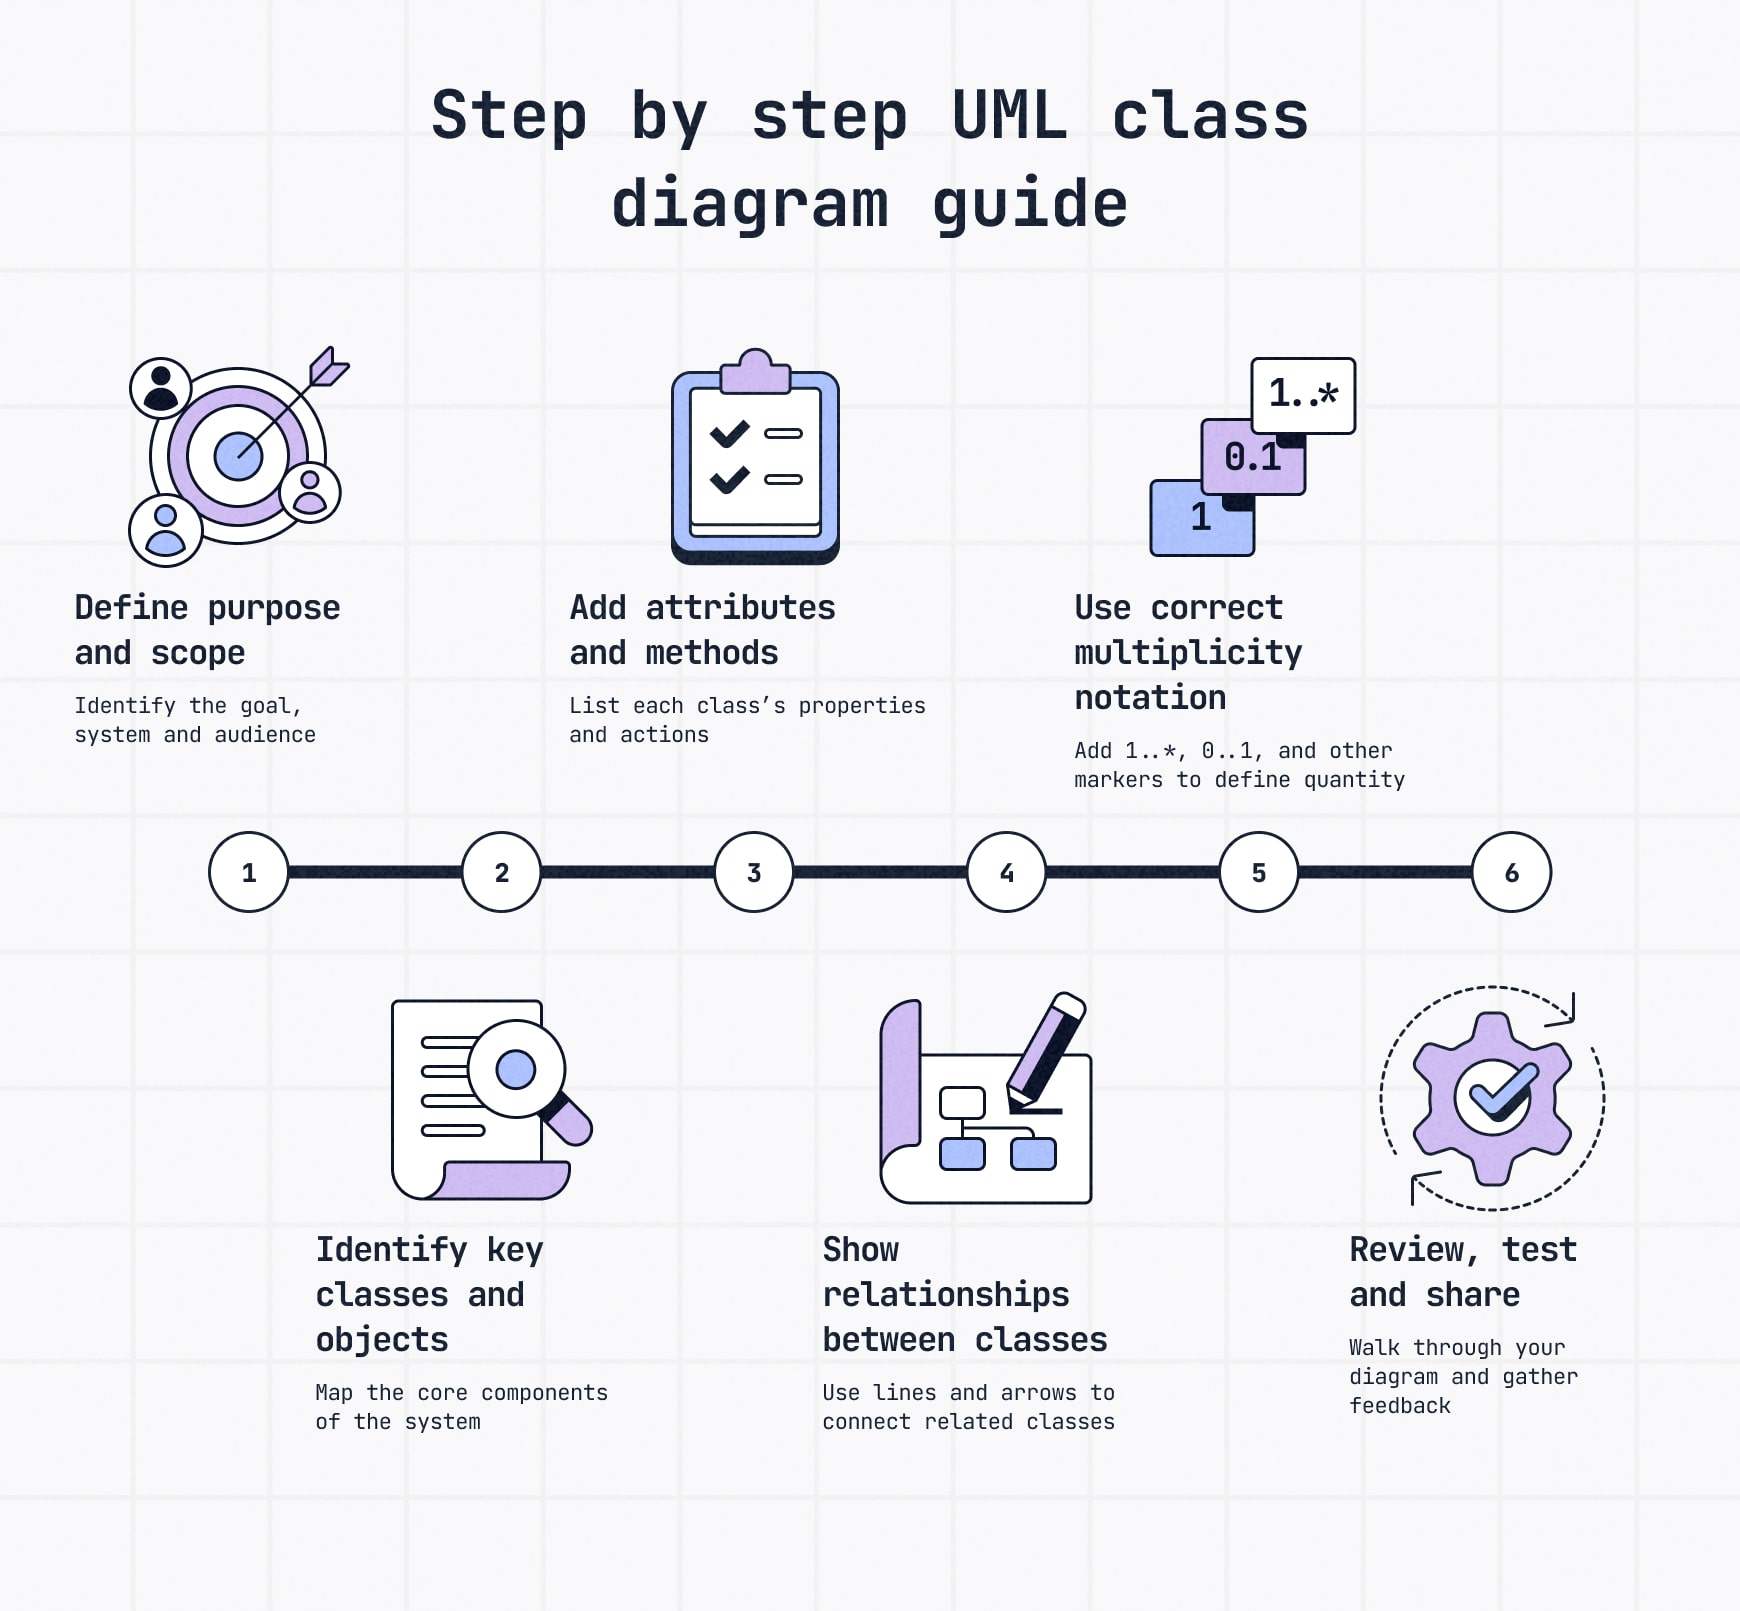
This step-by-step walkthrough shows how to build your own class diagram, one of the most common types of UML diagrams, with a real-world example to guide each step.
Step 1: Define purpose & scope
Before you draw anything, get clear on why you’re making the UML class diagram and what it needs to show.
Ask yourself:
- What system or feature am I modeling?
- Who needs to understand this — developers, stakeholders, designers?
- Am I showing static structure (how things are organized) or dynamic behavior (how they interact)?
For a class diagram, you’re usually focusing on static structure, like classes, attributes, methods and how they relate. Nailing this early keeps your diagram clean and useful.
To make this guide simple and clear, we’ll use the NFL as our running example.
Step 2: Identify key classes and objects
Now that you’ve defined your purpose, identify the main classes and objects in the system — the core building blocks you’ll represent.
Classes are the major categories in your diagram, like Team, Player and Coach in our NFL example.
Each one will later hold its own attributes (properties) and methods (actions), but for now, just map the key pieces.
🔎 Example:
For the NFL system:
- Team — Represents an NFL team (e.g., Cincinnati Bengals, Cleveland Browns).
- Player — Represents individual players on a team.
- Coach — Represents the staff who train and manage players.
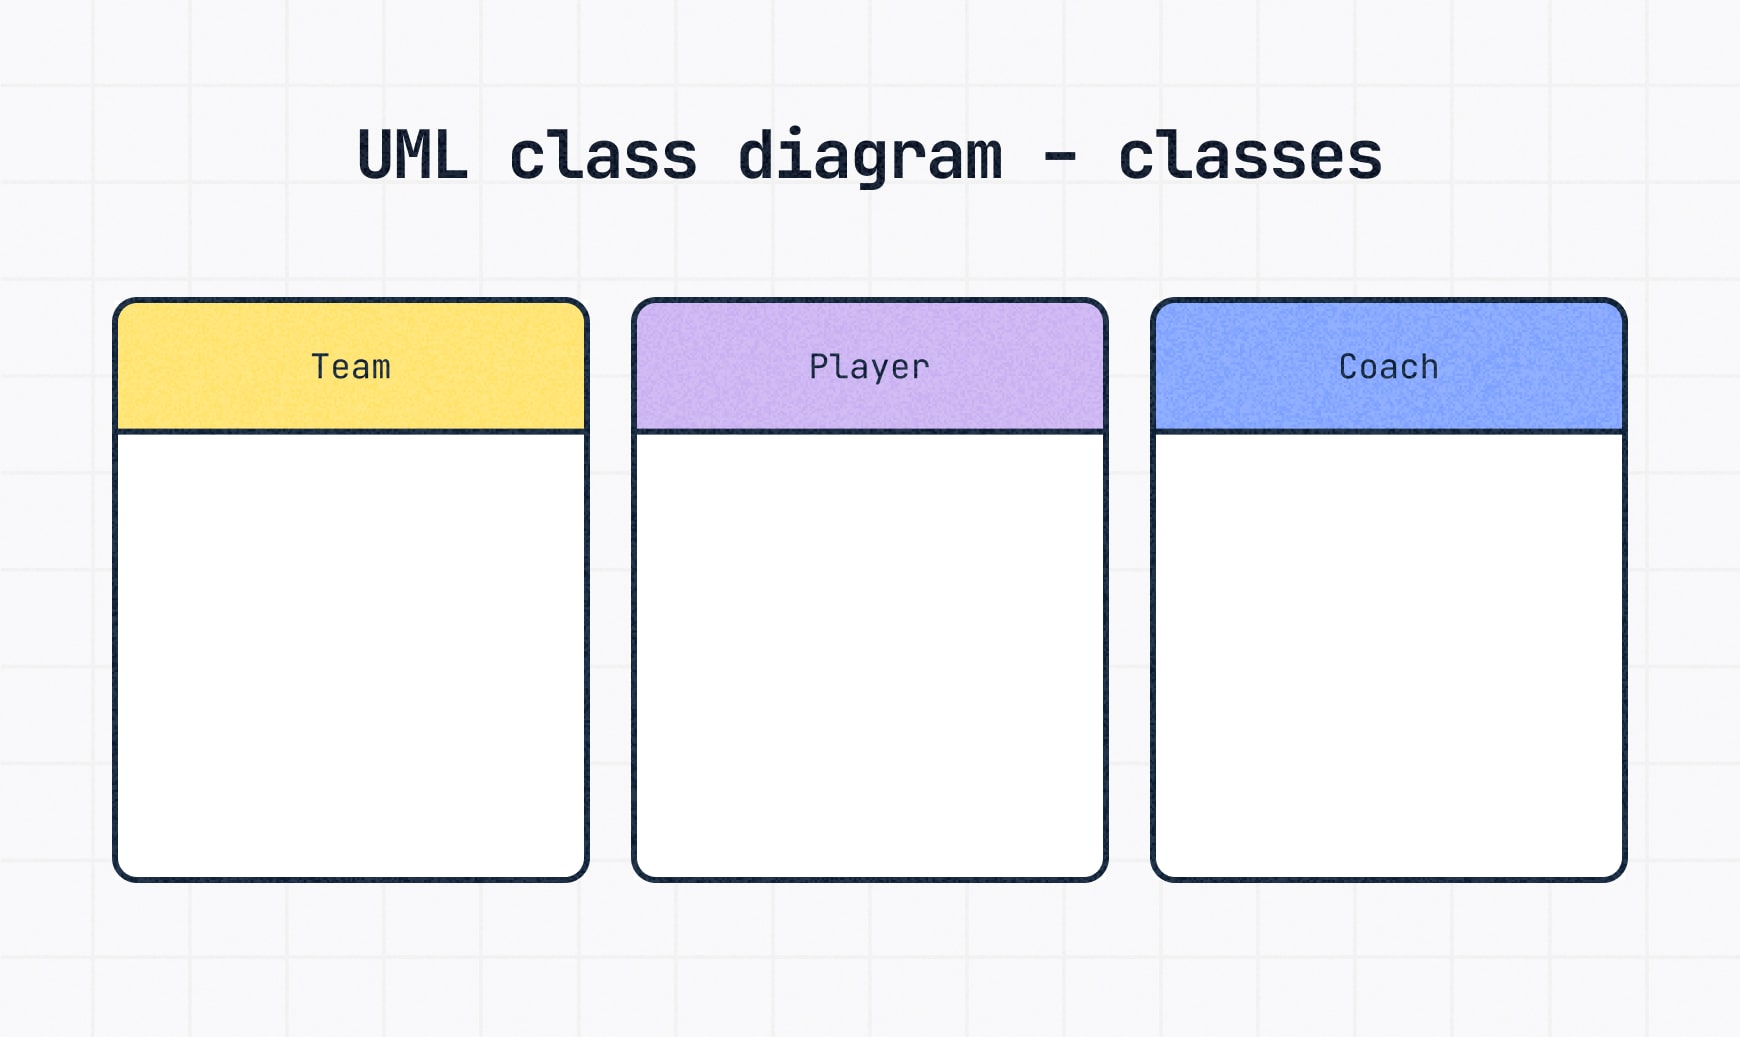
💡 Tip: Don’t overcomplicate it at this stage. Focus on core classes that define the system. You can always add supporting classes later.
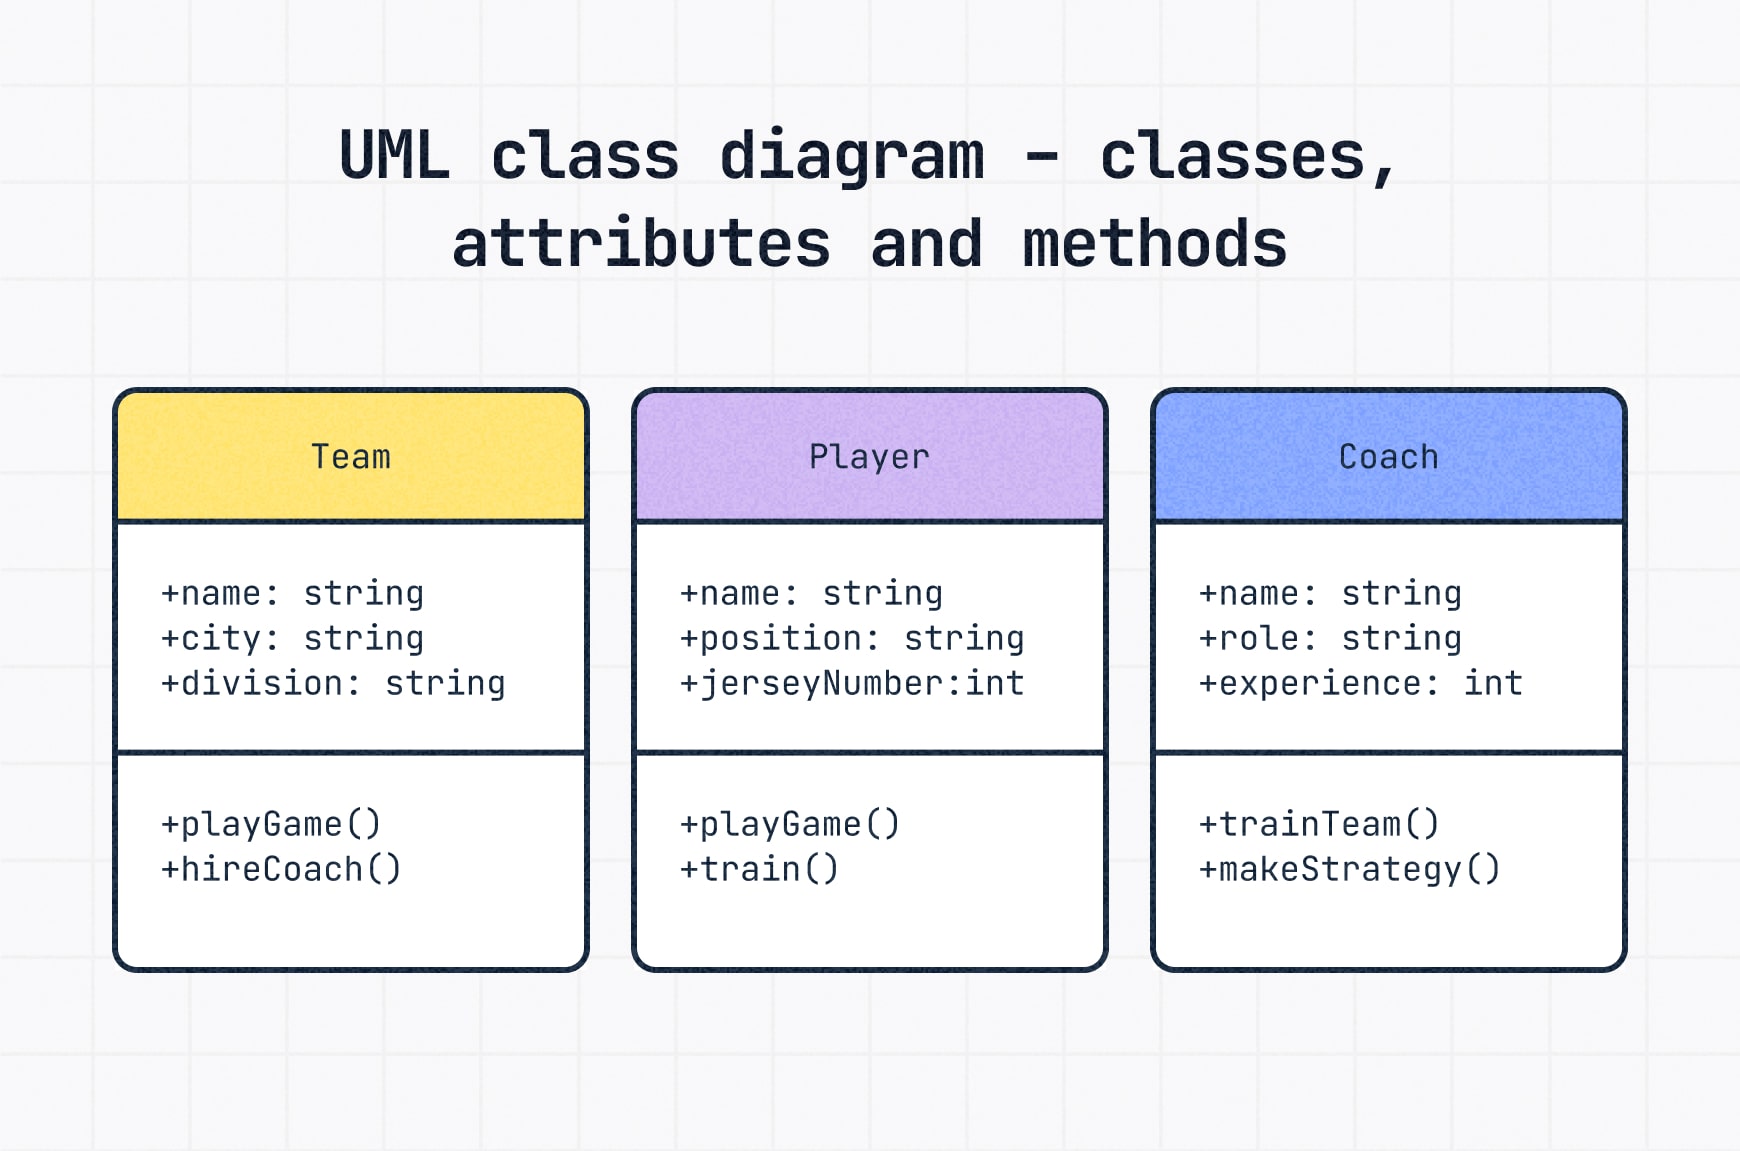
Step 3: Add attributes and methods
Once you’ve mapped out your classes, it’s time to add details, starting with attributes and methods.
- Attributes describe the properties of a class — the data or characteristics it holds.
- Methods, also called operations or functions, describe the actions that a class can perform.
Each class box is divided into three sections:
- Top: Class name
- Middle: Attributes
- Bottom: Methods
🔎 Example:
For our simple NFL system (obviously, the real NFL is much more complex):
- Team
- Attributes: +name: String, +city: String, +division: String
Translation: The attributes a team has are: team name, city and division it plays in - Methods: +playGame(), +hireCoach()
Translation: The actions a team can take are to play games and hire a coach - Player
- Attributes: +name: String, +position: String, +jerseyNumber: Integer
Translation: The attributes a player has are: name, position and jersey number - Methods: +playGame(), +train()
Translation: The actions a player can take are to play games and train - Coach
- Attributes: +name: String, +role: String, +experience: Integer
Translation: The attributes a coach has are: name, coaching role and experience - Methods: +trainTeam(), +makeStrategy()
Translation: The actions a coach can take are to train the team and create strategy
💬Quick format notes:
- Use +, -, #, or ~ before each attribute or method to show visibility:
- + Public (accessible by other classes)
- – Private (not accessible by other classes)
- # Protected (accessible by subclasses)
- ~ Package (accessible by classes in the same package)
- Always use a colon (:) to separate the name and type for attributes.
- Methods are listed with parentheses () to show they’re functions, known as method parameters
Step 4: Show relationships between classes
Now that your classes are built, the next step is to show how they relate.
Relationships define how classes interact, depend on or contain each other. They’re a core part of what makes your UML class diagram useful.
Here are the main types:
Inheritance (Generalization)
When one class inherits attributes and methods from another, forming a parent-child relationship.
🔎 Example: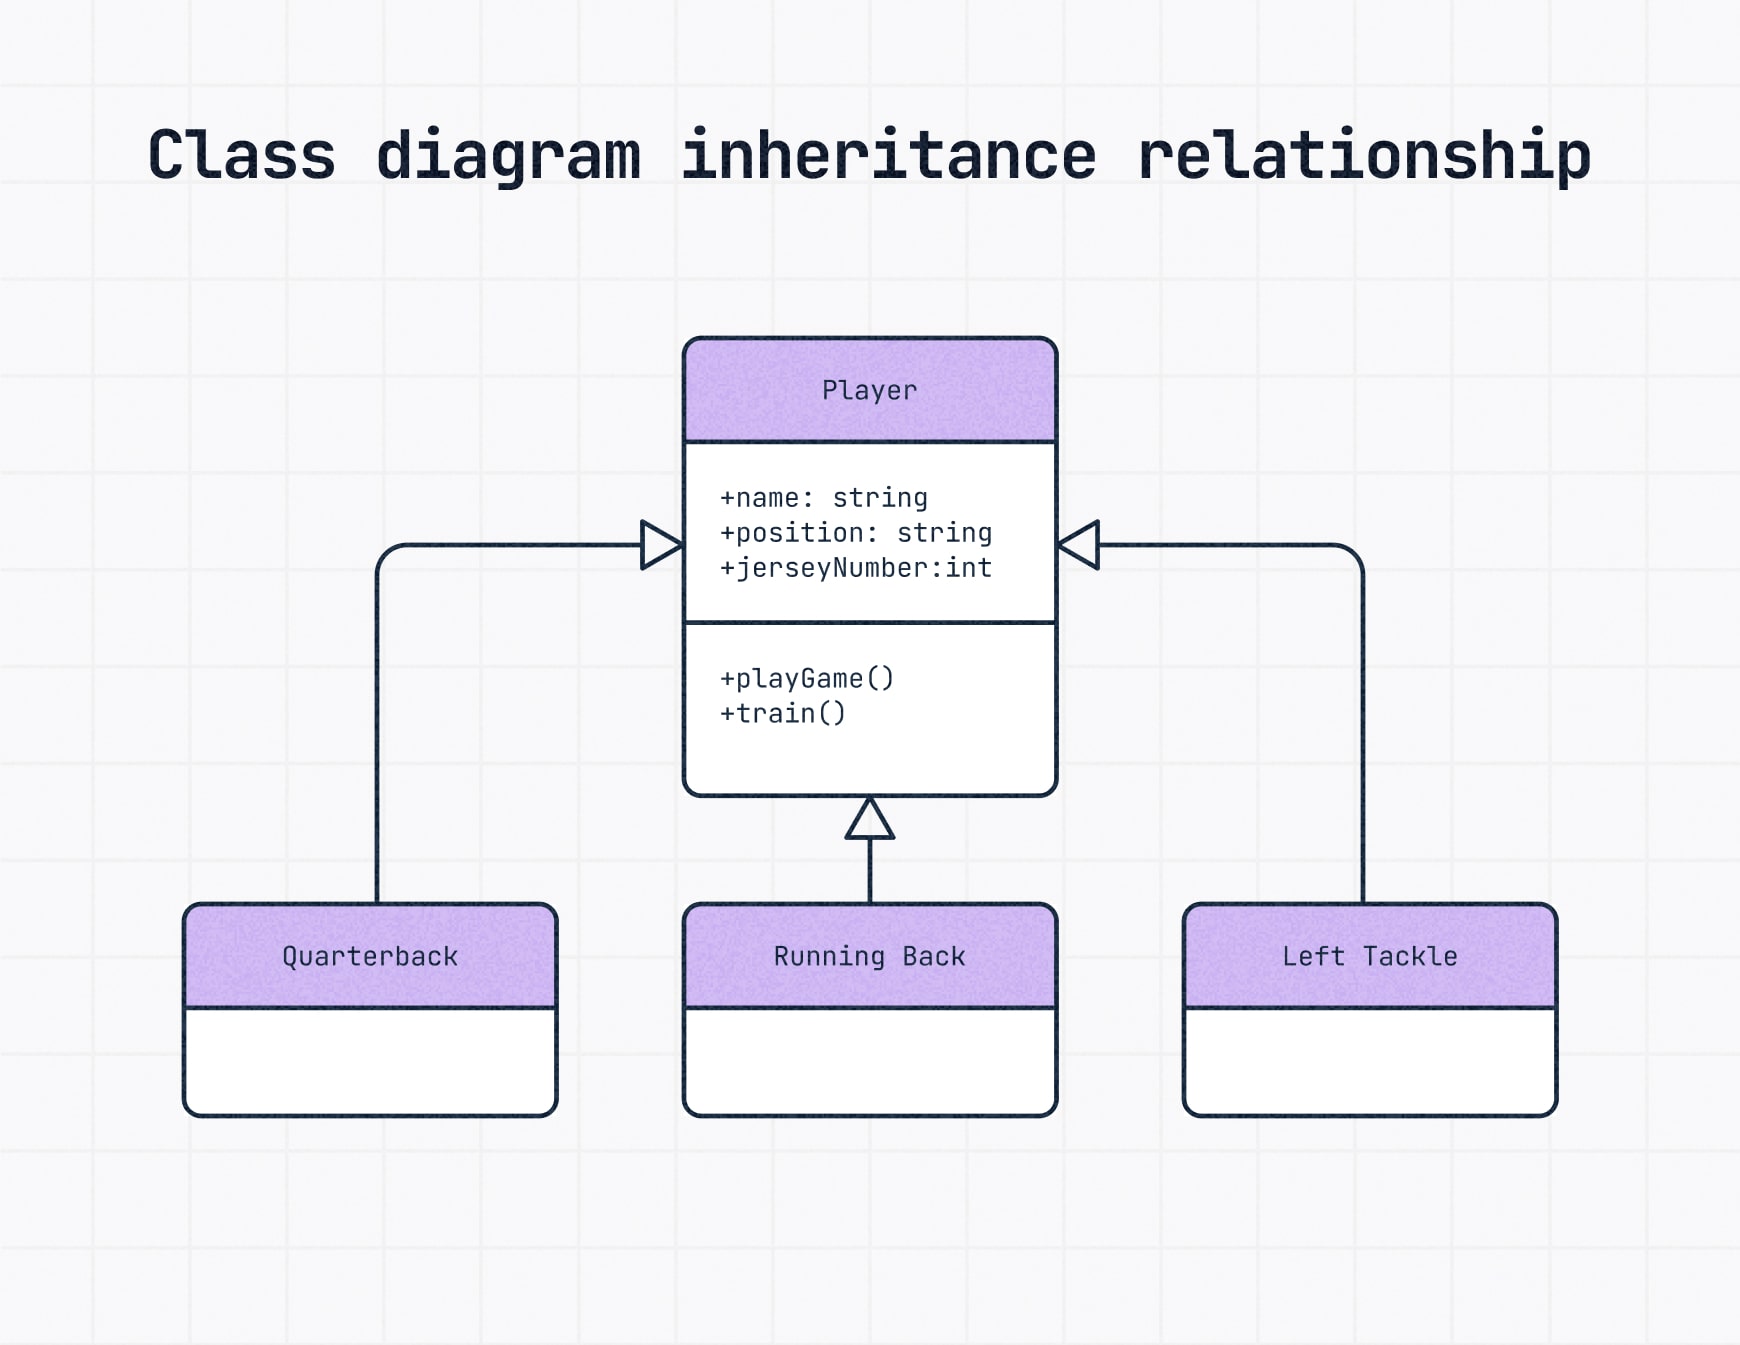
Quarterback, Running Back and Wide Receiver can all inherit the methods and attributes from the Player class.
- Drawn with a solid line and a hollow triangle arrow pointing to the parent class.
💡 Deeper dive: If a class acts as a blueprint for others (like Player), it’s considered an abstract class. Show that using italics or with <<abstract>> above the class name.
Aggregation
An association where one class contains other classes, like a whole being made of many parts.
Note that the contained classes can still exist independently.
🔎 Example: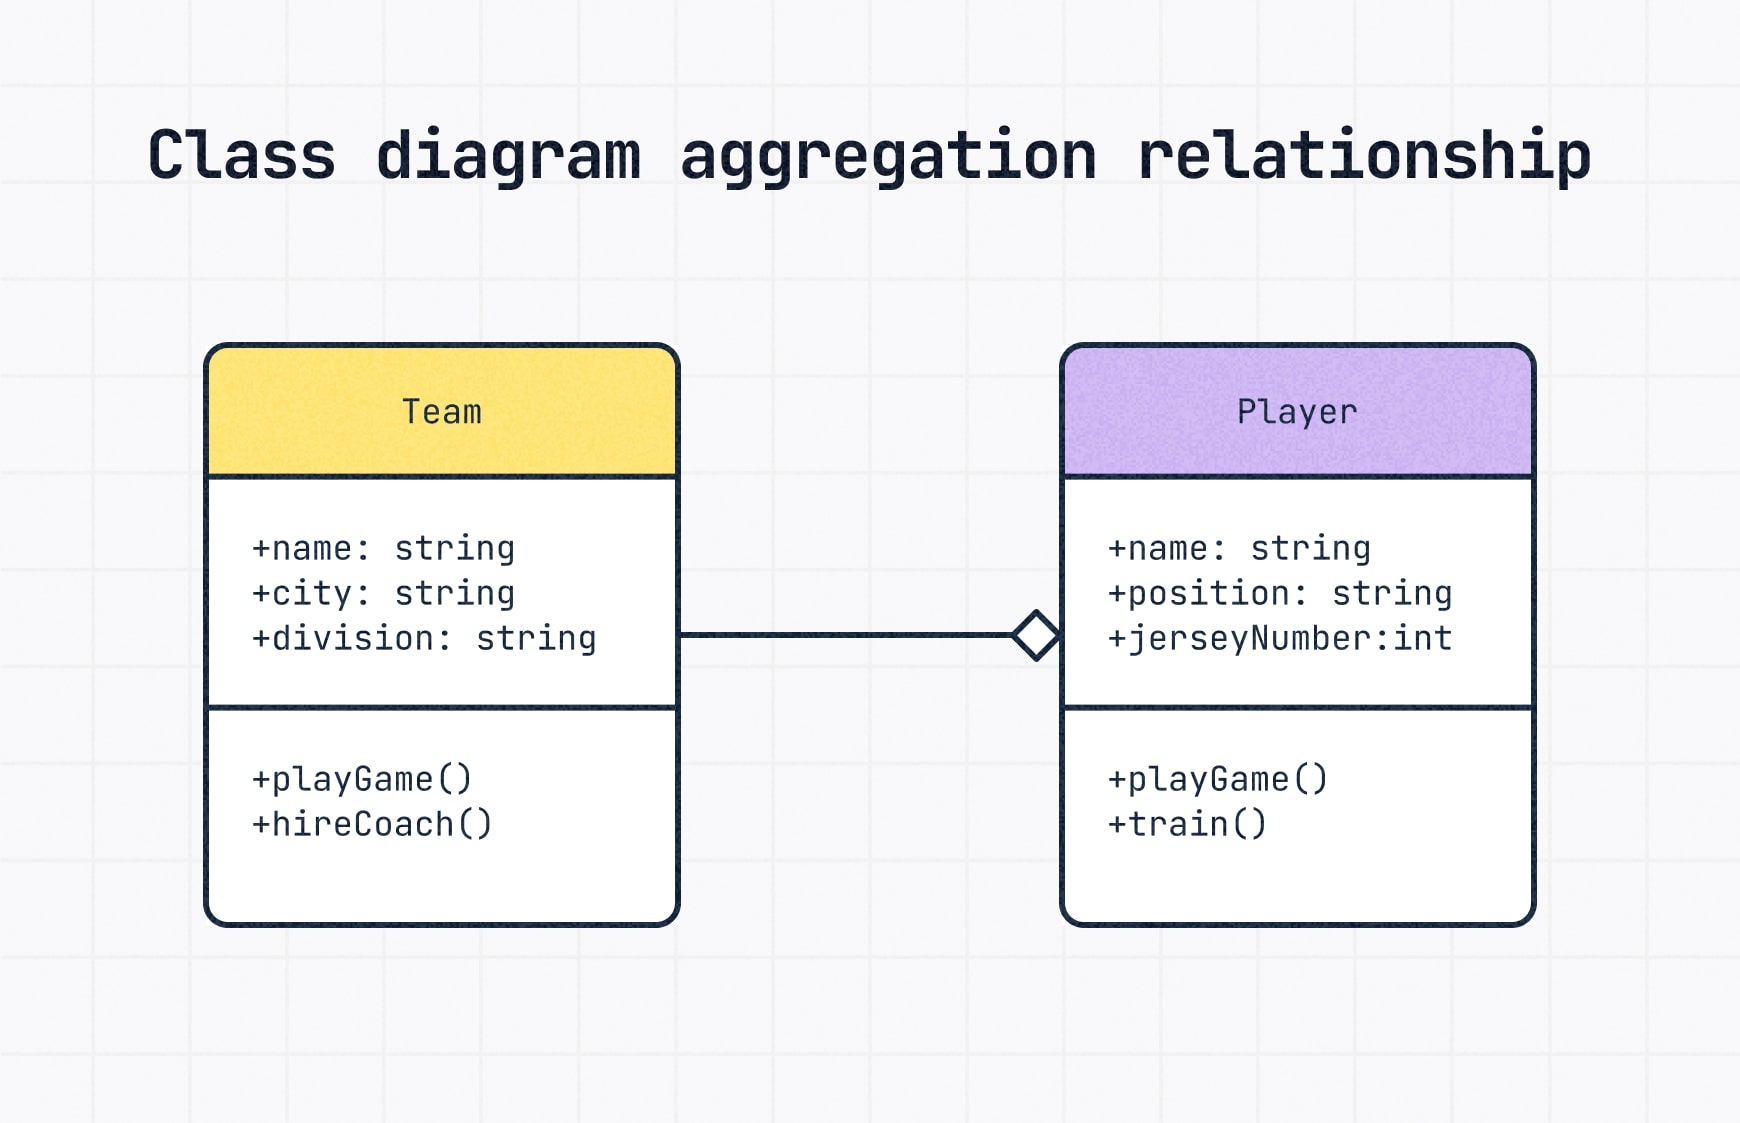
A Team aggregates multiple Players, but players could switch teams or become free agents.
- Drawn with a hollow diamond attached to the "part" with a solid line going back to the "whole" or class.
Composition
The opposite of aggregation, where the contained class cannot exist without the container.
🔎 Example: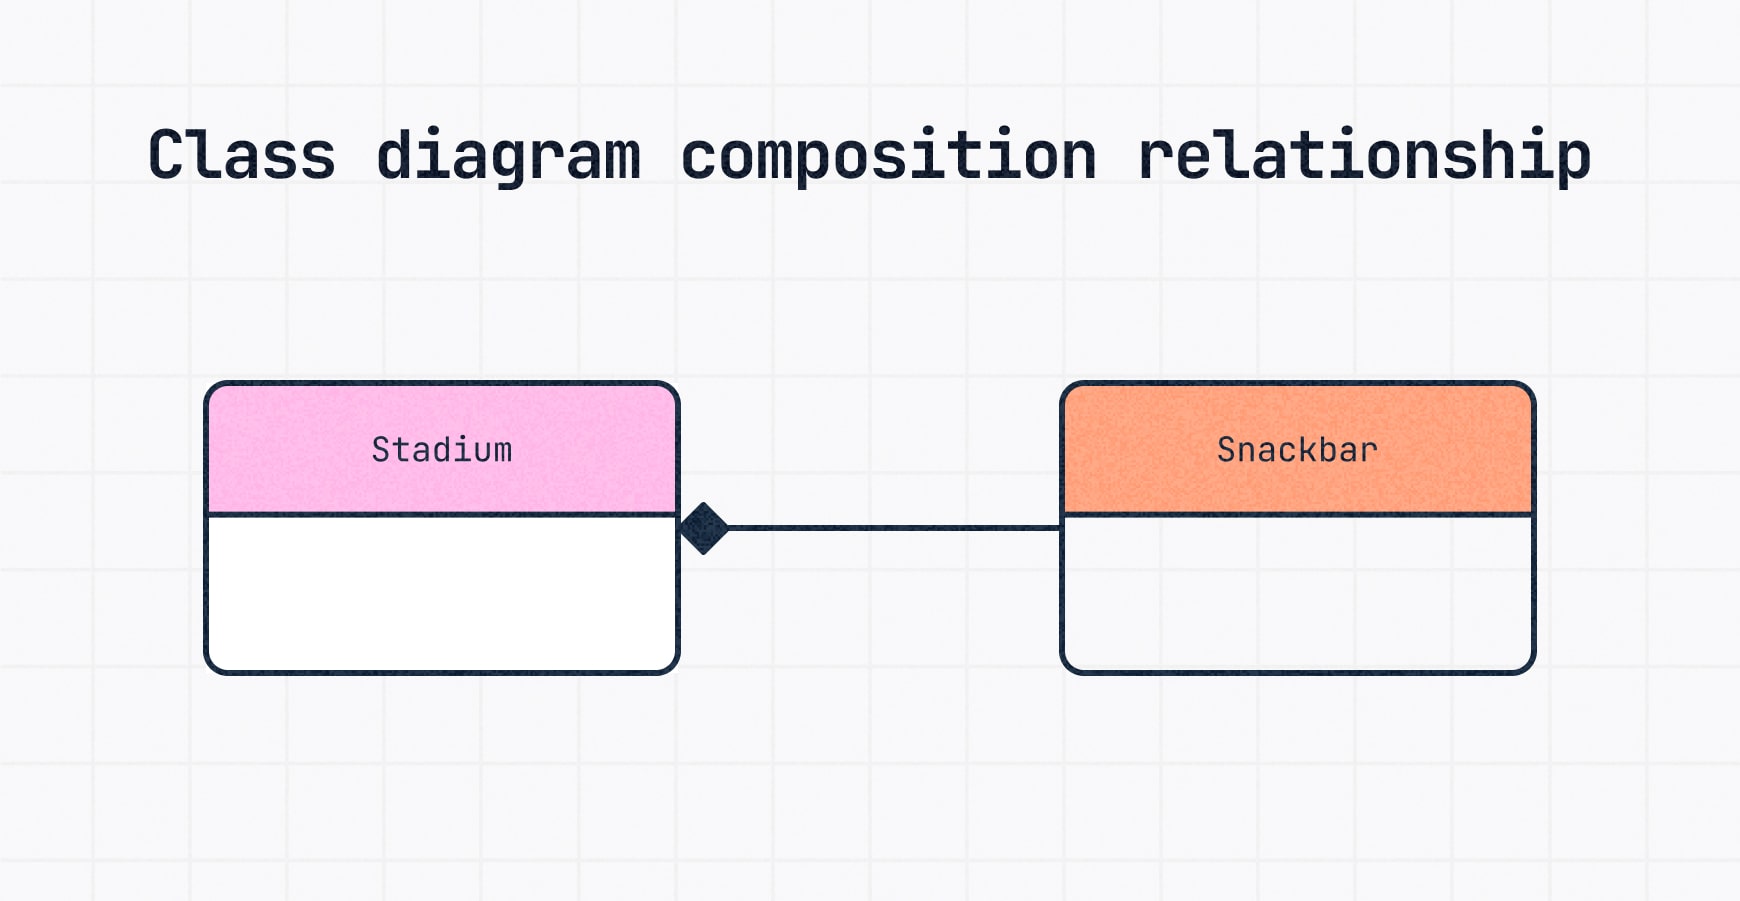
A stadium contains snack bars, but if the stadium is gone, so are the snacks.
- Drawn with a filled (black) diamond at the containing class (Stadium).
Dependency
A temporary relationship where a class relies on another class to function correctly, often for parameters, data or temporary links.
🔎 Example: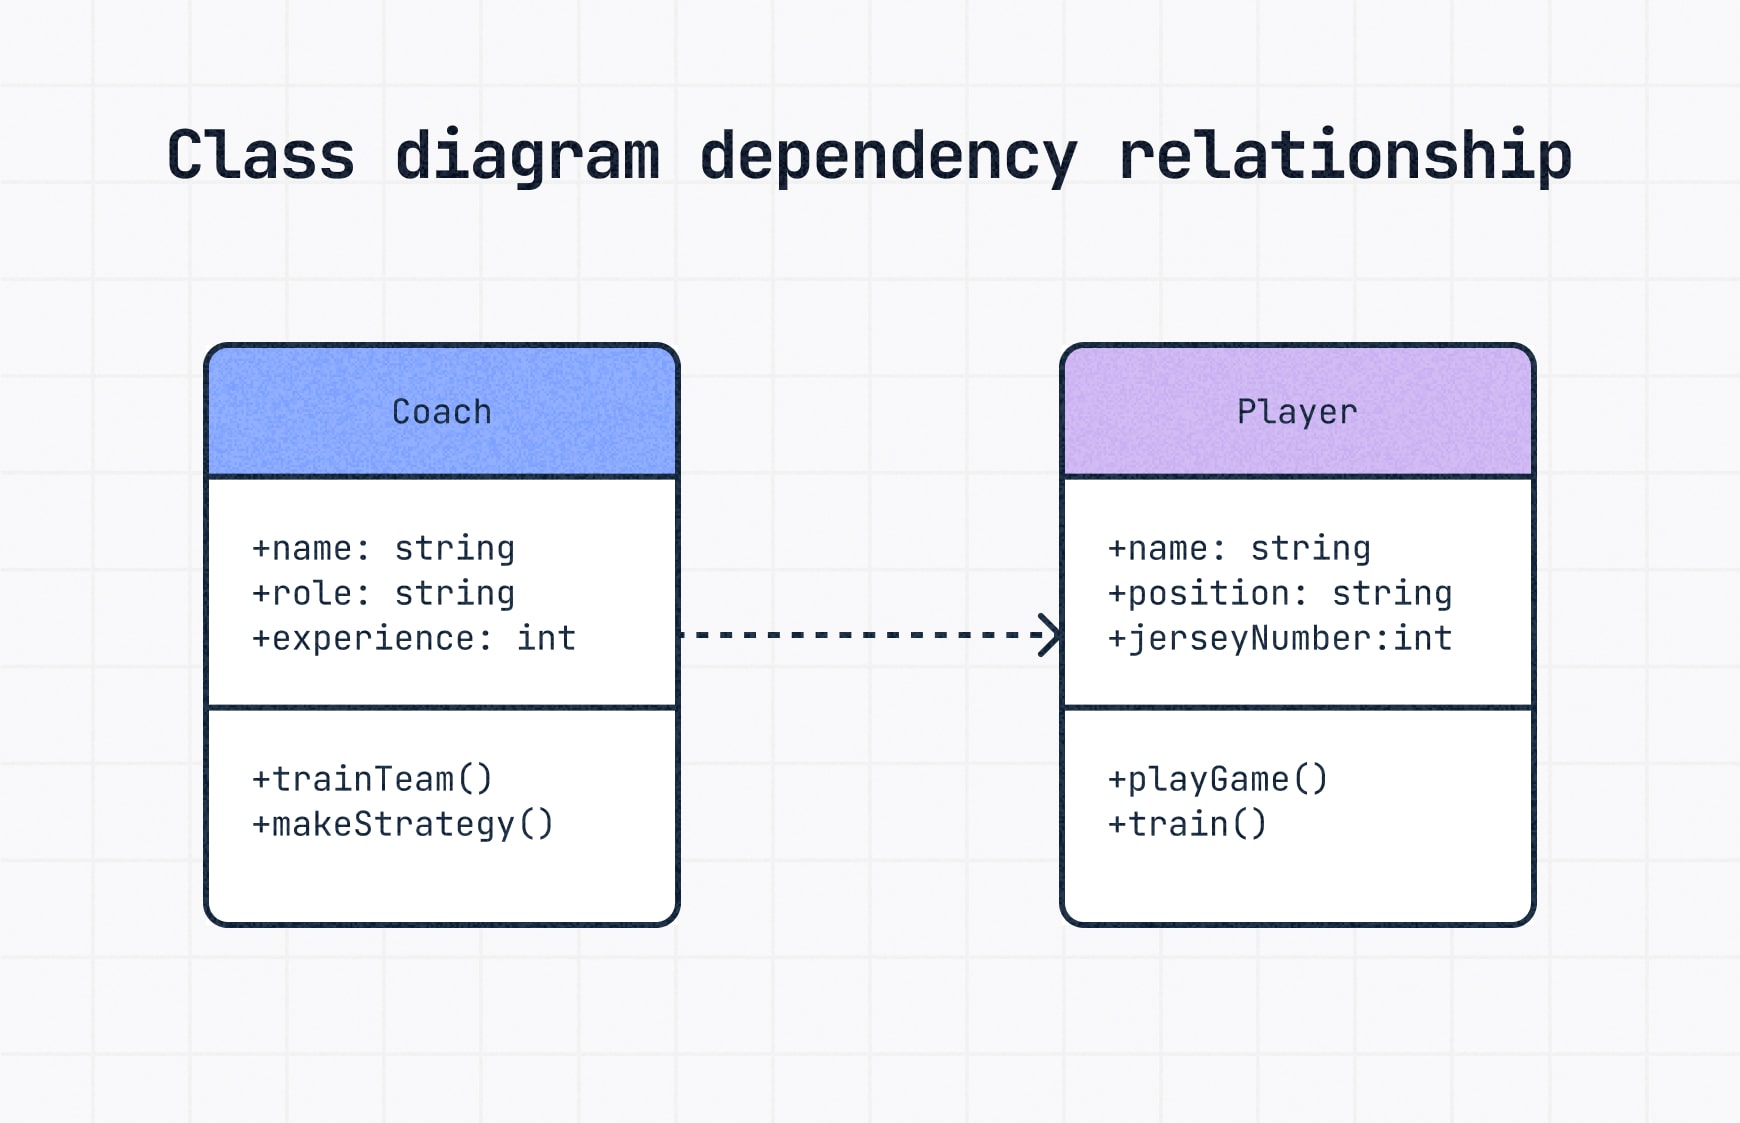
A Coach depends on Player performance data to make game strategies.
- Drawn with a dashed line and an open arrow pointing to the dependent class.
Step 5: Use correct multiplicity notation
Multiplicity shows how many instances of one class relate to another. It’s an important part of class diagrams because it sets the real-world rules your system needs to follow.
You’ll usually place multiplicity markers at the ends of association lines.
Common multiplicity notations:
| Symbol | Meaning |
|---|---|
| 1 | Exactly one |
| 0..1 | Zero or one |
| 0..* | Zero or many (optional relationship) |
| 1..* | One or many (mandatory relationship) |
| n..m | A specific range (e.g., 2..4 = two to four instances) |
🔎 Example:
A Team has one or more Players → 1..*
💡 Tip: Use multiplicity when it’s not obvious. It adds clarity and helps avoid false assumptions.
Step 6: Review, test and share
Once your UML class diagram is mapped out, don’t just call it done — take time to review it carefully.
Here’s a quick checklist:
- Review:
Scan for missing attributes, unclear relationships or incorrect multiplicity. Keep naming consistent across the diagram. - Test:
Mentally walk through the system using your diagram. Can you follow how it works? Would someone new to the project understand it? - Share:
Get feedback from your team. Diagrams are communication tools, not just pretty drawings – so real collaboration makes them stronger.
💡 Tip: Even the best diagrams need a second (or third) set of eyes. Sharing early improves accuracy, avoids misunderstandings and helps the diagram evolve with your system.
Best Practices for UML diagramming
Even a simple UML diagram can get messy fast.
Follow these best practices to keep your diagrams clean, clear and useful — whether you’re modeling a new feature or an entire system.
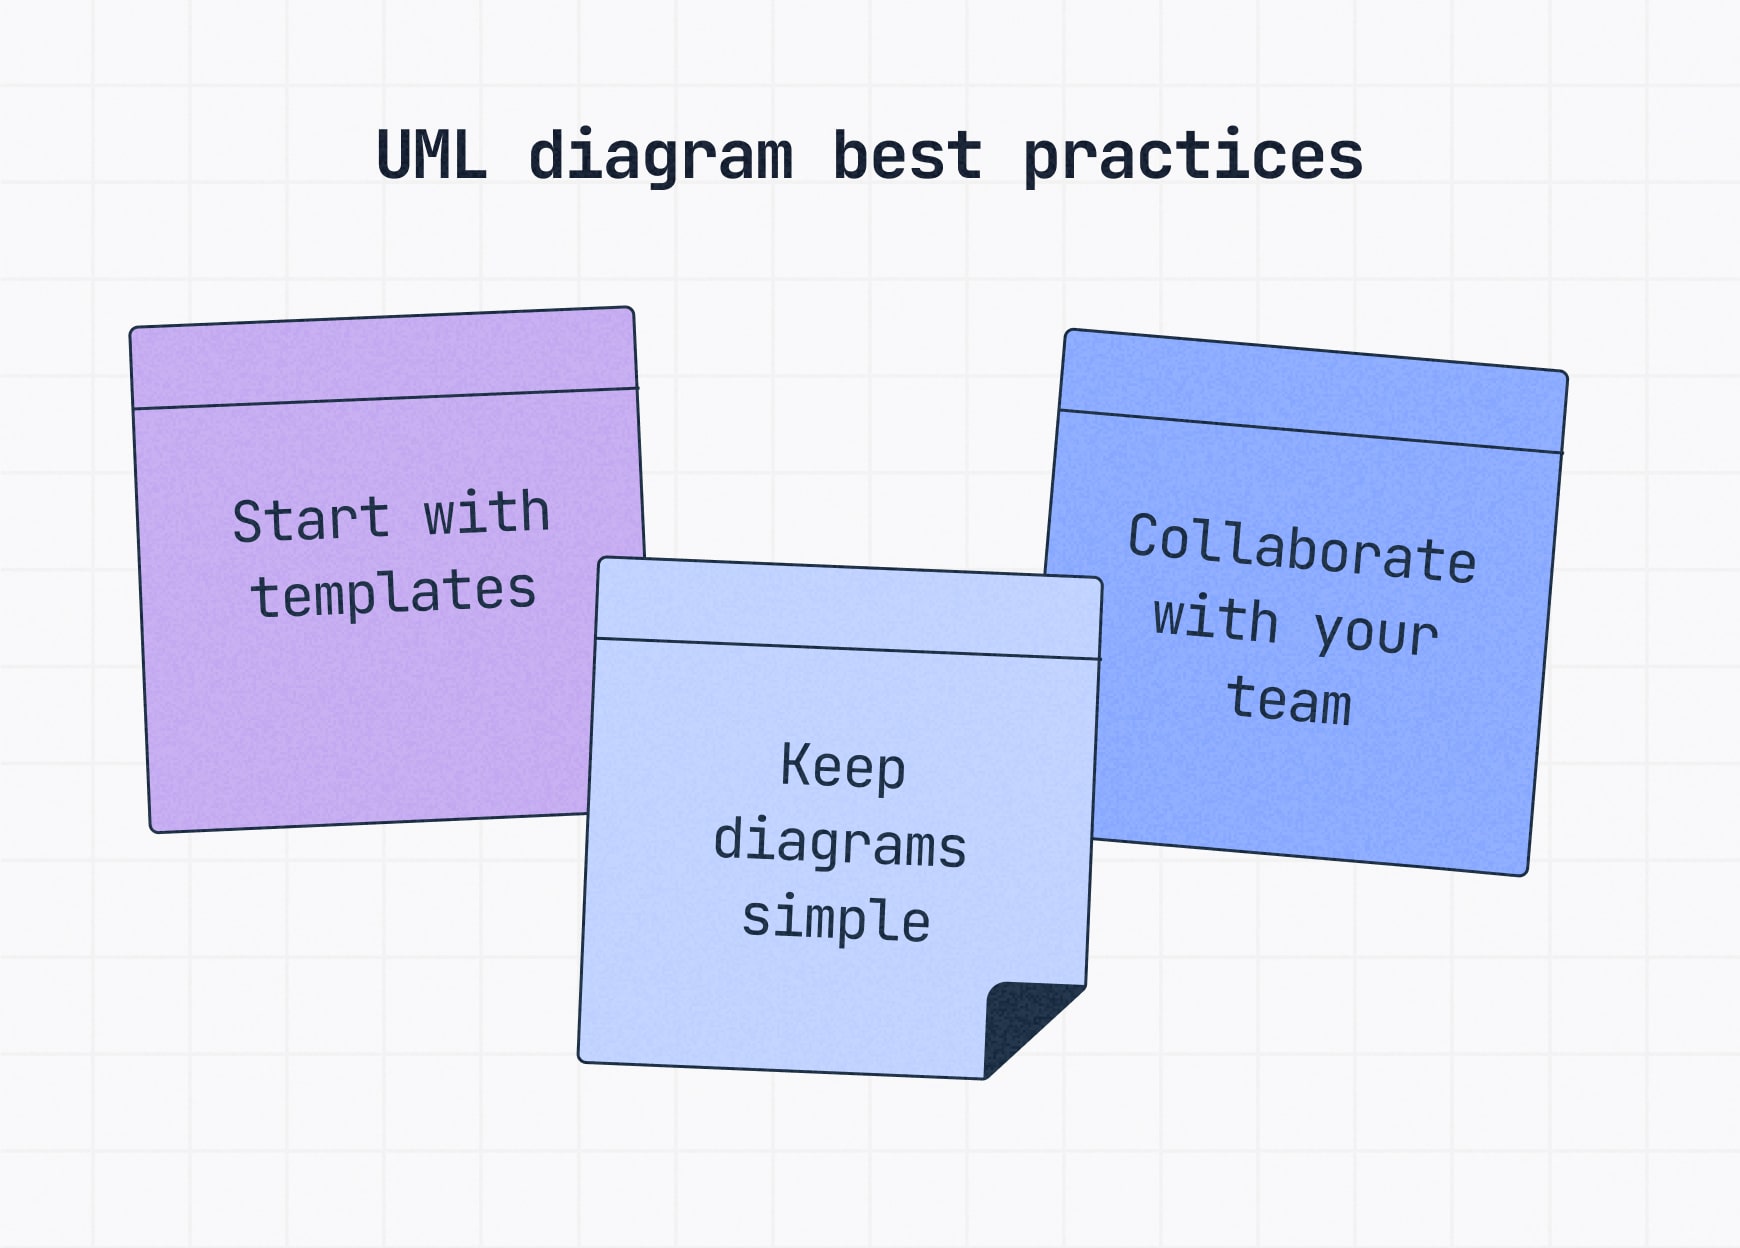
Start with templates
If you’re new to UML or short on time, using UML diagram templates can save hours.
Templates give you the core structure, like class boxes, connectors and correct UML notation — so you can focus on content, not formatting.
Keep diagrams simple
It’s tempting to show every tiny detail, but more isn’t always better.
Focus on the core classes, relationships, attributes and methods. If the diagram feels overwhelming, split it into smaller, purpose-specific views.
Collaborate with your team early and often
Don’t build in a vacuum.
Sharing your diagram early with developers, designers and stakeholders helps catch gaps and misalignments before they become problems.
Tools like Slickplan’s Diagram Maker are built for teams, making collaboration fast and seamless.
Common mistakes to avoid
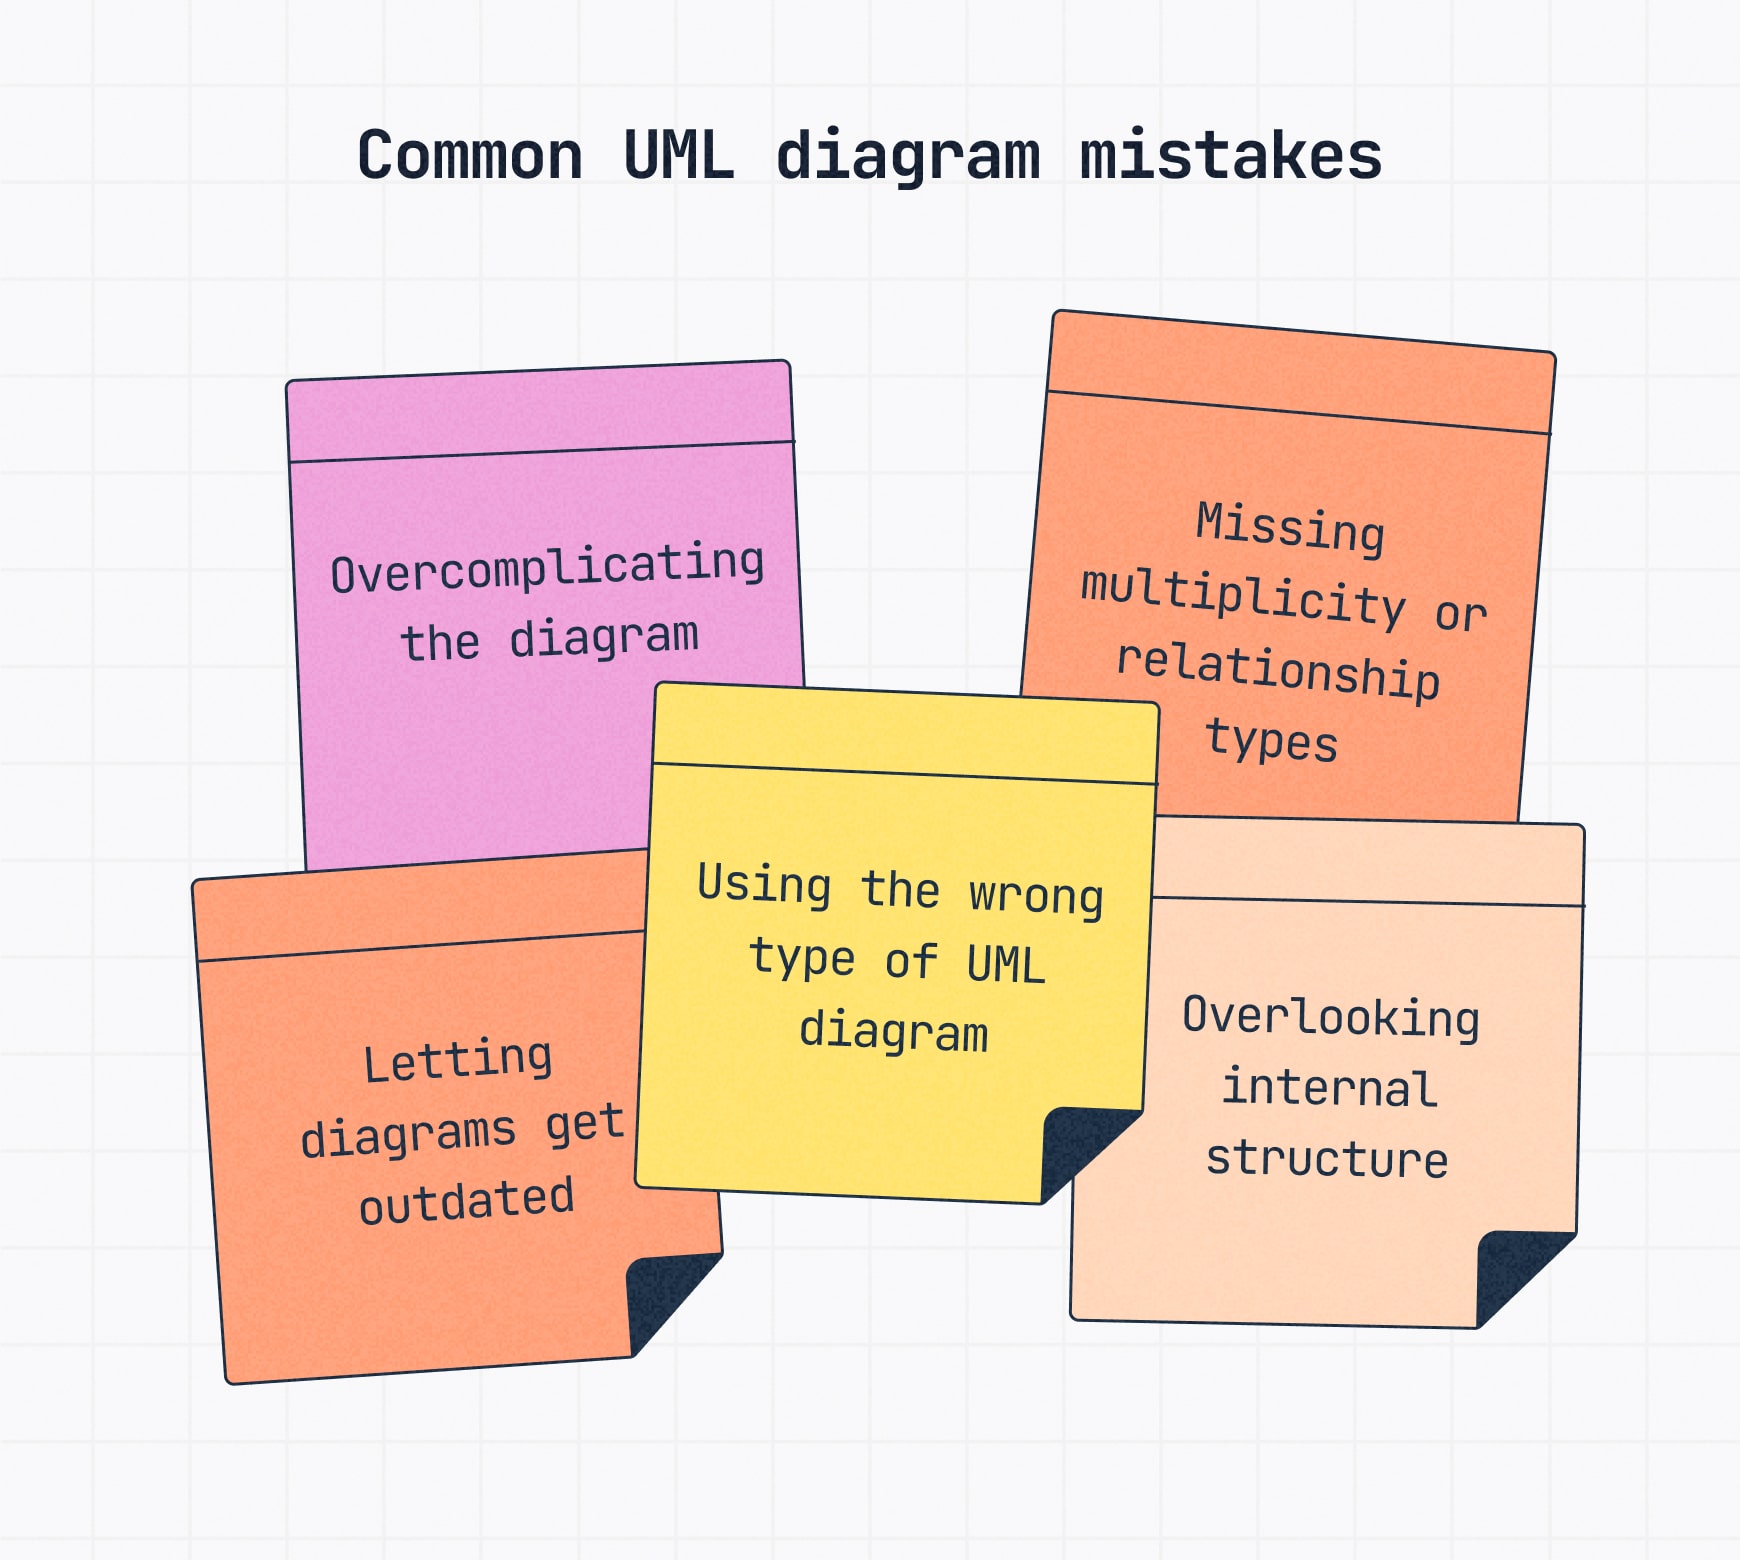
Overcomplicating the diagram
Trying to show everything in one diagram makes it hard to read — and harder to update.
✅ Do this instead: Focus on one class and its key relationships. If it gets too crowded, break it into smaller diagrams.
Missing multiplicity or relationship types
Skipping multiplicity markers (1..*, 0..1) or using vague connectors weakens your diagram’s clarity.
✅ Fix it: Always show how many of each class is involved and what kind of relationship they share.
Letting diagrams get outdated
UML diagrams are only useful if they reflect your system as it evolves.
✅ Keep them fresh: Update diagrams alongside your system, especially after releases, refactors or architecture changes.
Using the wrong type of UML diagram
Structural diagrams show how systems are organized. Behavioral diagrams show how they act and change. Mixing the two leads to confusing, ineffective diagrams.
✅ The fix: Use structural diagrams for static parts and behavioral diagrams for flows and interactions.
Overlooking internal structure
Some parts of a system have important internal elements that shape how the whole system works. Leaving them out oversimplifies the design and hides critical details.
✅ Solution: Always show important internal structures clearly, whether through detailed classes, nested components or specialized diagrams when needed.
UML diagram tools and templates
You don’t have to build every UML diagram from scratch — or do it alone. The right tools and templates make it faster, clearer, and easier to collaborate.
Tools that make UML diagramming easier
Not all flowchart software is built for UML. Look for a diagram maker that has:
- A dedicated UML shape library with correct symbols
- Support for multiplicity notation and relationship types
- Easy sharing and collaboration features to work with your team
🔎 Recommendation: Slickplan’s diagram creator lets you create and customize UML diagrams fast with team editing built right in.
- Intuitive interface — Drag-and-drop diagramming that’s ideal for both technical and non-technical team members.
- Collaboration features — Seamless real-time team editing, commenting and sharing.
- Connected planning tools — Combine UML diagramming with content planning, sitemap creation and UX design in a single platform.
- Ready-to-use UML templates — Start instantly with professionally designed templates that simplify your diagramming tasks.
Check out a few of the time-saving templates in Slickplan’s library:
When to use (and when not to use) UML diagrams
UML diagrams are powerful tools when used at the right time. Here’s when they shine (and when they don’t).
✅ Best times to use UML diagrams:
- Modeling complicated systems
Break down large, complicated structures into simple visuals. - Planning software architecture
Create a clear blueprint for developers to build from. - Mapping business processes
Help stakeholders visualize workflows and organizational structures. - Communicating across teams
Bridge gaps between technical and non-technical audiences.
🚫 When UML might not be the right fit
- Quick ideas or brainstorming
Rough sketches, flowcharts or even creating affinity diagrams are faster for early-stage thinking. - Very small or simple systems
UML can overcomplicate projects that only need 2–3 objects or steps. - When your team isn’t familiar with UML
Forcing formal diagrams can slow down communication rather than improve it.
Why UML diagrams still matter
UML diagrams make complex systems easier to understand, design and communicate across teams, industries and tech stacks.
By picking the right type, keeping it simple and collaborating early, you can build diagrams that don’t just map your system — they make it stronger.
Whether you’re designing apps, mapping workflows or planning big builds, a solid UML diagram is still one of the smartest tools you can have.
Ready to build your own UML diagrams? Slickplan’s Diagram Maker makes it easy to model systems, processes and architecture with your team. Start your free, 14-day trial today.


Think visually. Improve UX with Slickplan
Build intuitive user flows, stronger customer journeys and improve information architecture.
Frequently asked questions
What is the main purpose of UML diagrams?
UML diagrams are used to visualize and document the structure or behavior of a system. They help teams design better software by providing a shared visual language. UML simplifies communication, planning, and documentation across development, architecture, and business analysis teams.
What is a UML diagram used for in software development?
UML diagrams help teams plan, visualize, and document how a software system is structured or behaves. They make it easier to explain complex systems, align stakeholders and identify issues early in development. UML is widely used in the architecture, planning and documentation phases of software projects.
What's the difference between structural and behavioral UML diagrams?
Structural diagrams show the static parts of a system, like classes, objects and components. Behavioral diagrams focus on how things interact and change over time, including flows, user actions and system behavior. Each type supports different stages of planning, design and communication in system development.
How detailed should a UML diagram be?
Keep your diagram focused on what matters most. Include just enough detail to communicate structure or behavior clearly without overwhelming readers. If it starts getting crowded, break it into smaller diagrams. Simplicity improves clarity, especially when diagrams are shared across teams with varying technical experience.
Do I need special tools to create UML diagrams?
Yes. While basic flowchart tools can work, a proper UML diagram maker supports standardized symbols, relationship types and multiplicity. Look for tools with a UML shape library and collaboration features, like Slickplan, to build diagrams that are accurate, scalable and team-friendly from the start.


 X
X