When a decision has more than one possible path, the logic can get messy fast.
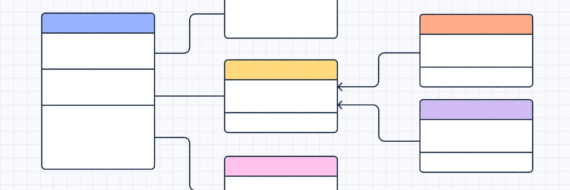
A decision tree is a branching diagram that shows how one question, problem or condition can lead to different choices and outcomes. It gives decision logic a visible structure, making it easier to compare paths, explain tradeoffs and reach a clear result.
In this guide, we’ll cover what a decision tree is, how decision trees work, common decision tree symbols, practical examples, decision tree analysis and how to create one with a no-code diagramming tool like Slickplan.
Key takeaways
- Make decision logic visible. Decision trees turn complex choices into a step-by-step structure that clarifies the decision-making process for individuals and teams.
- Use them to drive consistency and alignment. By mapping out every scenario in advance, teams can standardize processes, spot gaps in logic and get everyone on the same page faster.
- Build decision trees for people, systems or both. Teams can use no-code decision trees to map workflows and choices, while data teams can train decision tree models for classification or regression tasks.
What is a decision tree?
A decision tree is a visual diagram that maps a starting question or condition to possible choices and outcomes. Each branch represents a choice, condition or event that moves the decision in a specific direction. To read one, start at the first node, follow the branch that matches each answer or condition and continue until the path reaches a final outcome.
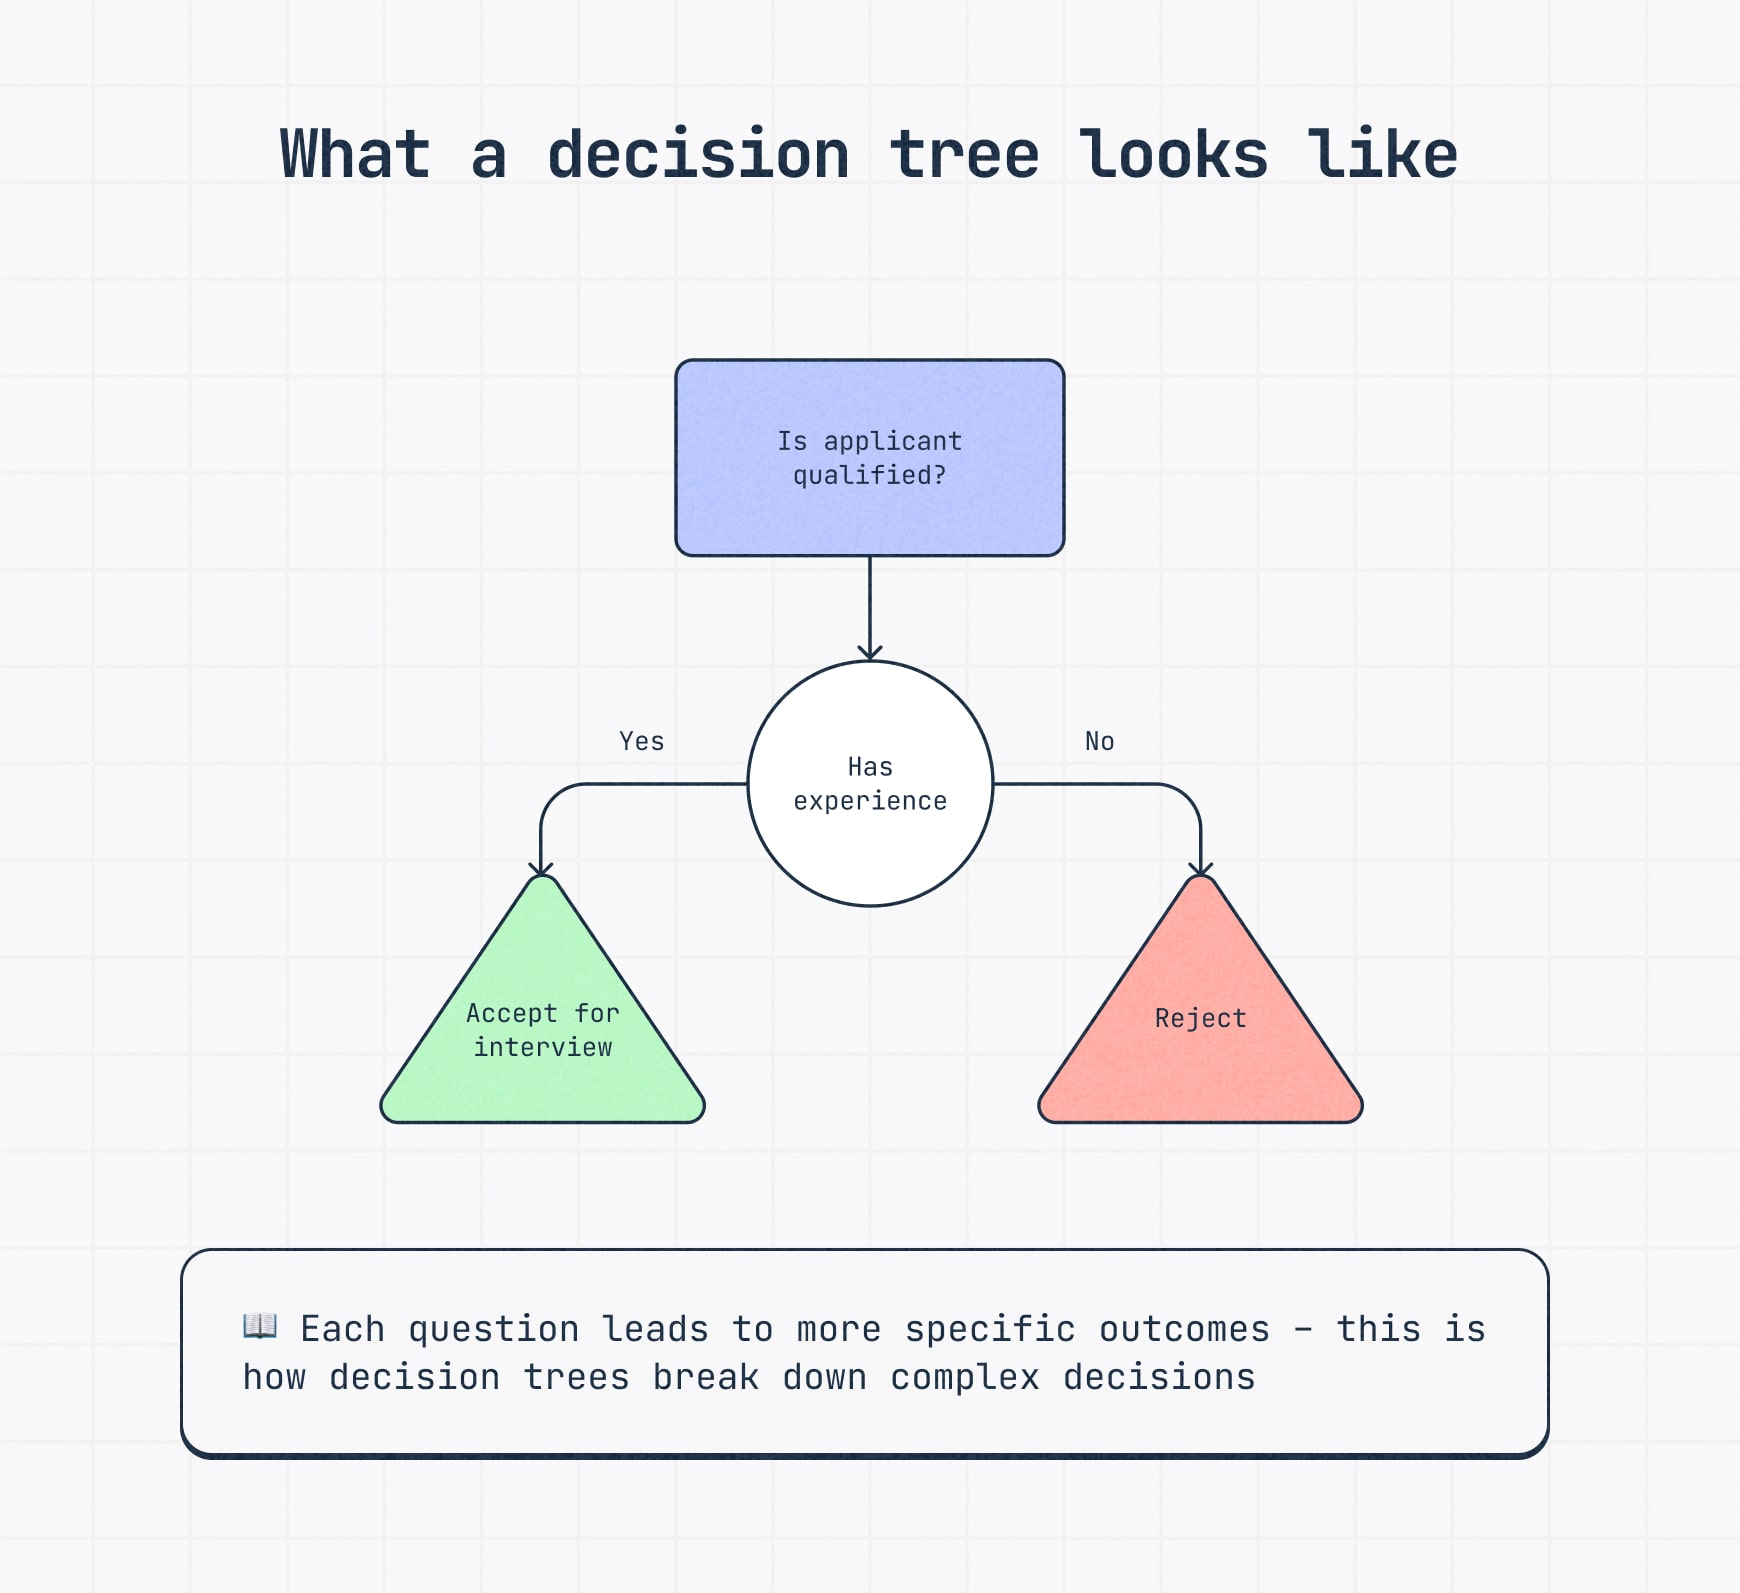
That straightforward structure is what makes decision trees useful. Instead of explaining logic in a long paragraph or spreadsheet, you can show each step in the decision-making process visually, making the path easier to follow, discuss and refine.
Simple decision tree example
Here’s an everyday example: choosing a snack.
The tree starts with a simple question: Are you hungry? If not, the path ends with drinking water. If yes, the next branch checks whether fruit is available. From there, the tree leads to a final outcome, like eating fruit or choosing a savory snack.
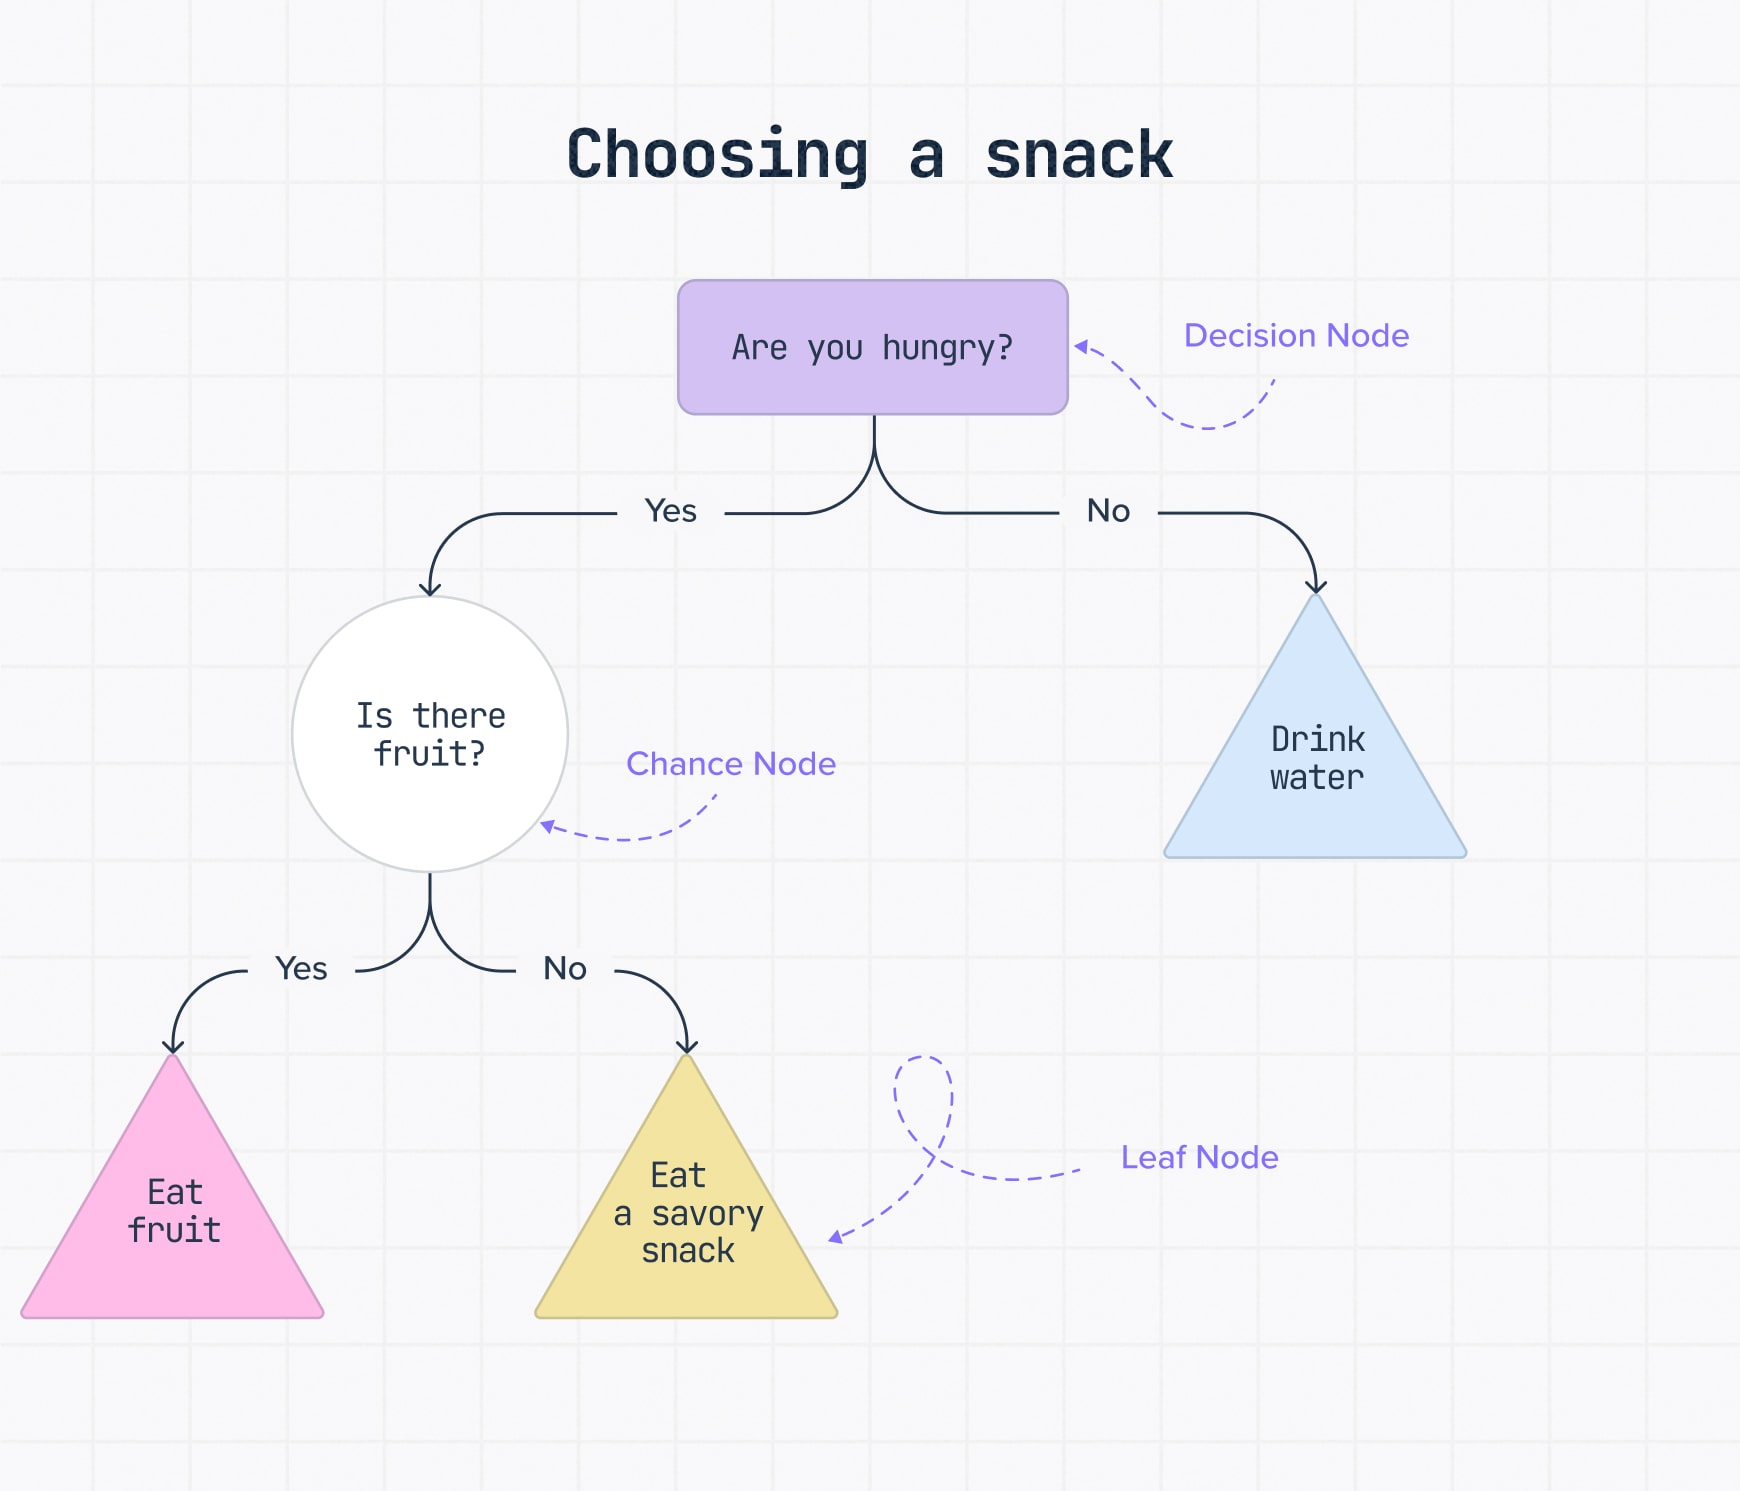
It’s a basic decision tree sample, but it shows the core logic clearly: each answer moves you to the next branch until the decision reaches an outcome.
🎬 Learn what Slickplan can do!
We filmed a short video to show you exactly how to use Slickplan
Parts of a decision tree: Nodes, branches and outcomes
Before getting into decision tree examples, it helps to understand the basic parts and how to read a decision tree. Most are built from a small set of nodes, branches and outcomes that show how a decision moves from one step to the next.
The exact shapes can vary depending on the tool, notation style or audience. Some decision trees use decision-analysis symbols, while others borrow standard flowchart shapes, but the core parts work the same way.
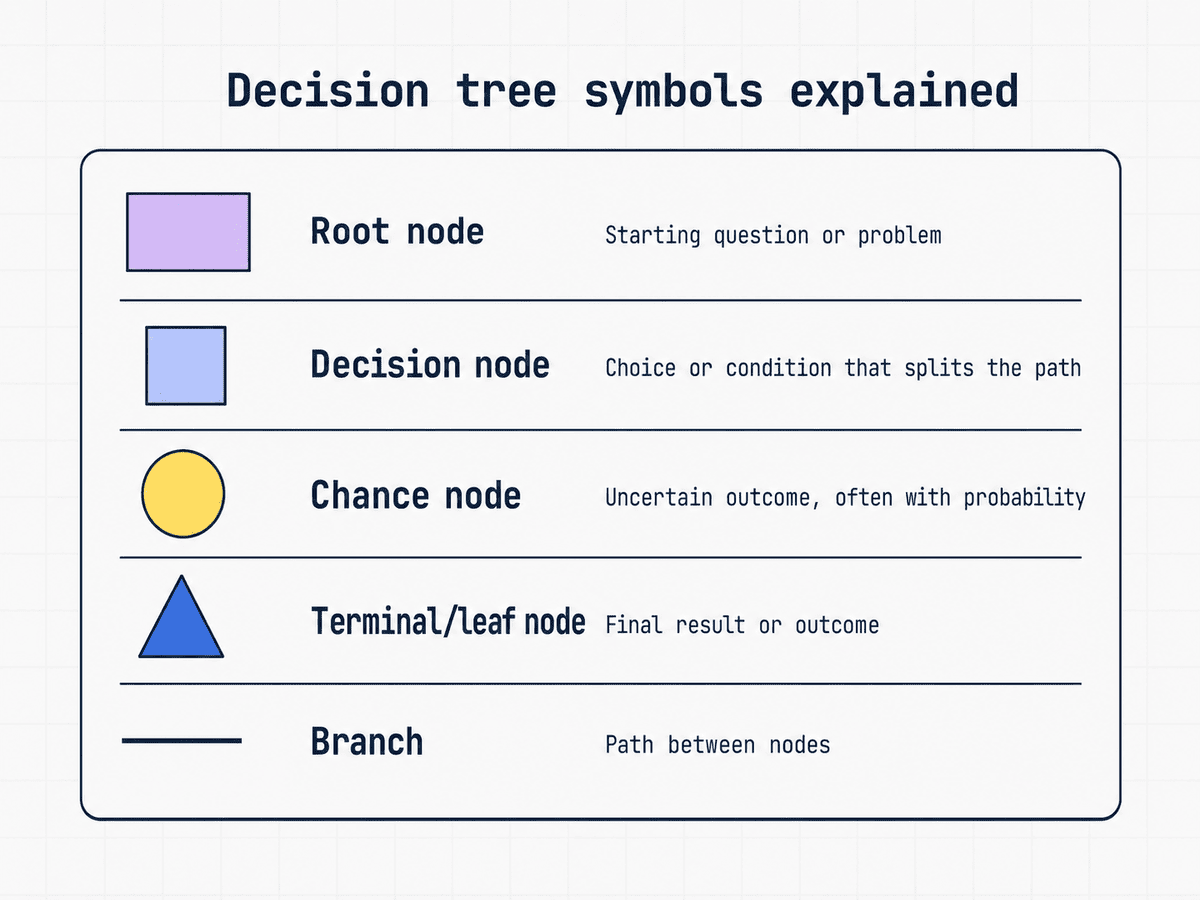
Root node
The starting point of the decision tree. This is the main question, condition or problem the tree is built around.
Decision node or internal node
A point where the tree asks a question, checks a condition or splits the path based on an answer.
Chance node
A point where an uncertain event can lead to multiple possible outcomes, often with probabilities or estimated likelihoods attached.
Leaf node or terminal node
The end of a path. This is the final result, such as “approve request,” “reject application” or “send follow-up email.”
Parent node
A node that splits into one or more child nodes.
Child node
A node that follows from a parent node and may lead to more branches or a final outcome.
Branch
A line that connects one node to the next and represents a possible choice, condition or outcome.
Decision tree examples
Decision trees can support everything from simple workflows to complex business and technical analysis. They’re useful because they turn branching choices into a clear, repeatable structure.
The examples below show how decision trees can clarify sales workflows, healthcare triage, product planning and machine learning logic. For UX-specific paths, user flow diagram examples can help map how people move through a product or website.
eCommerce decision tree example
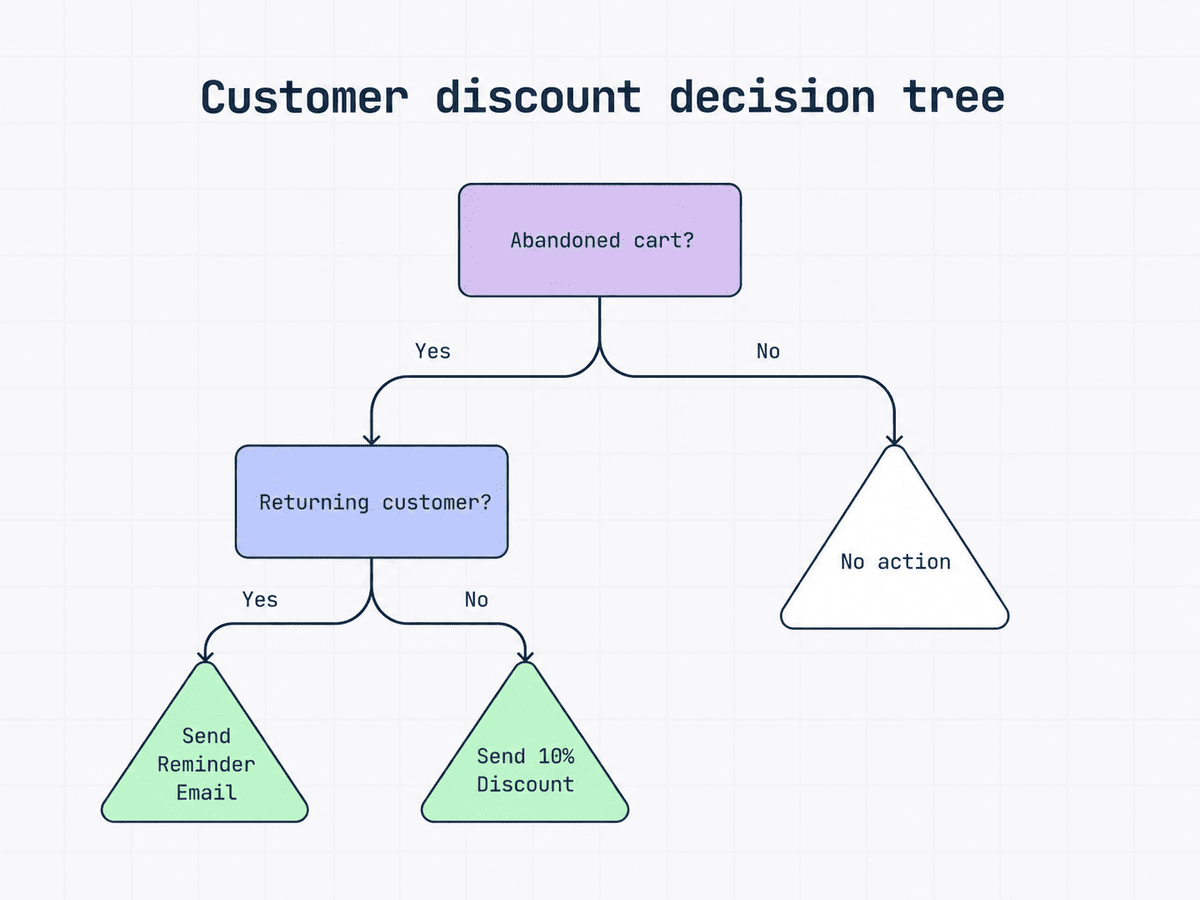
Let’s say you’re deciding what to do after someone abandons their cart.
The decision tree starts by asking whether the cart was abandoned. If not, no action is needed. If yes, the next step checks whether the person is a returning customer. A returning customer might only need a reminder email, while a first-time buyer may need a stronger incentive, like a 10% discount, to complete the purchase.
Medical triage decision tree example
In healthcare, decision trees can standardize responses in high-pressure situations.
This tree starts with a simple question: Is the patient experiencing abdominal pain? If yes, the next branch may check whether the pain is severe, sudden or mild. From there, the tree can guide the next step, like emergency review, further assessment or lower-priority care.
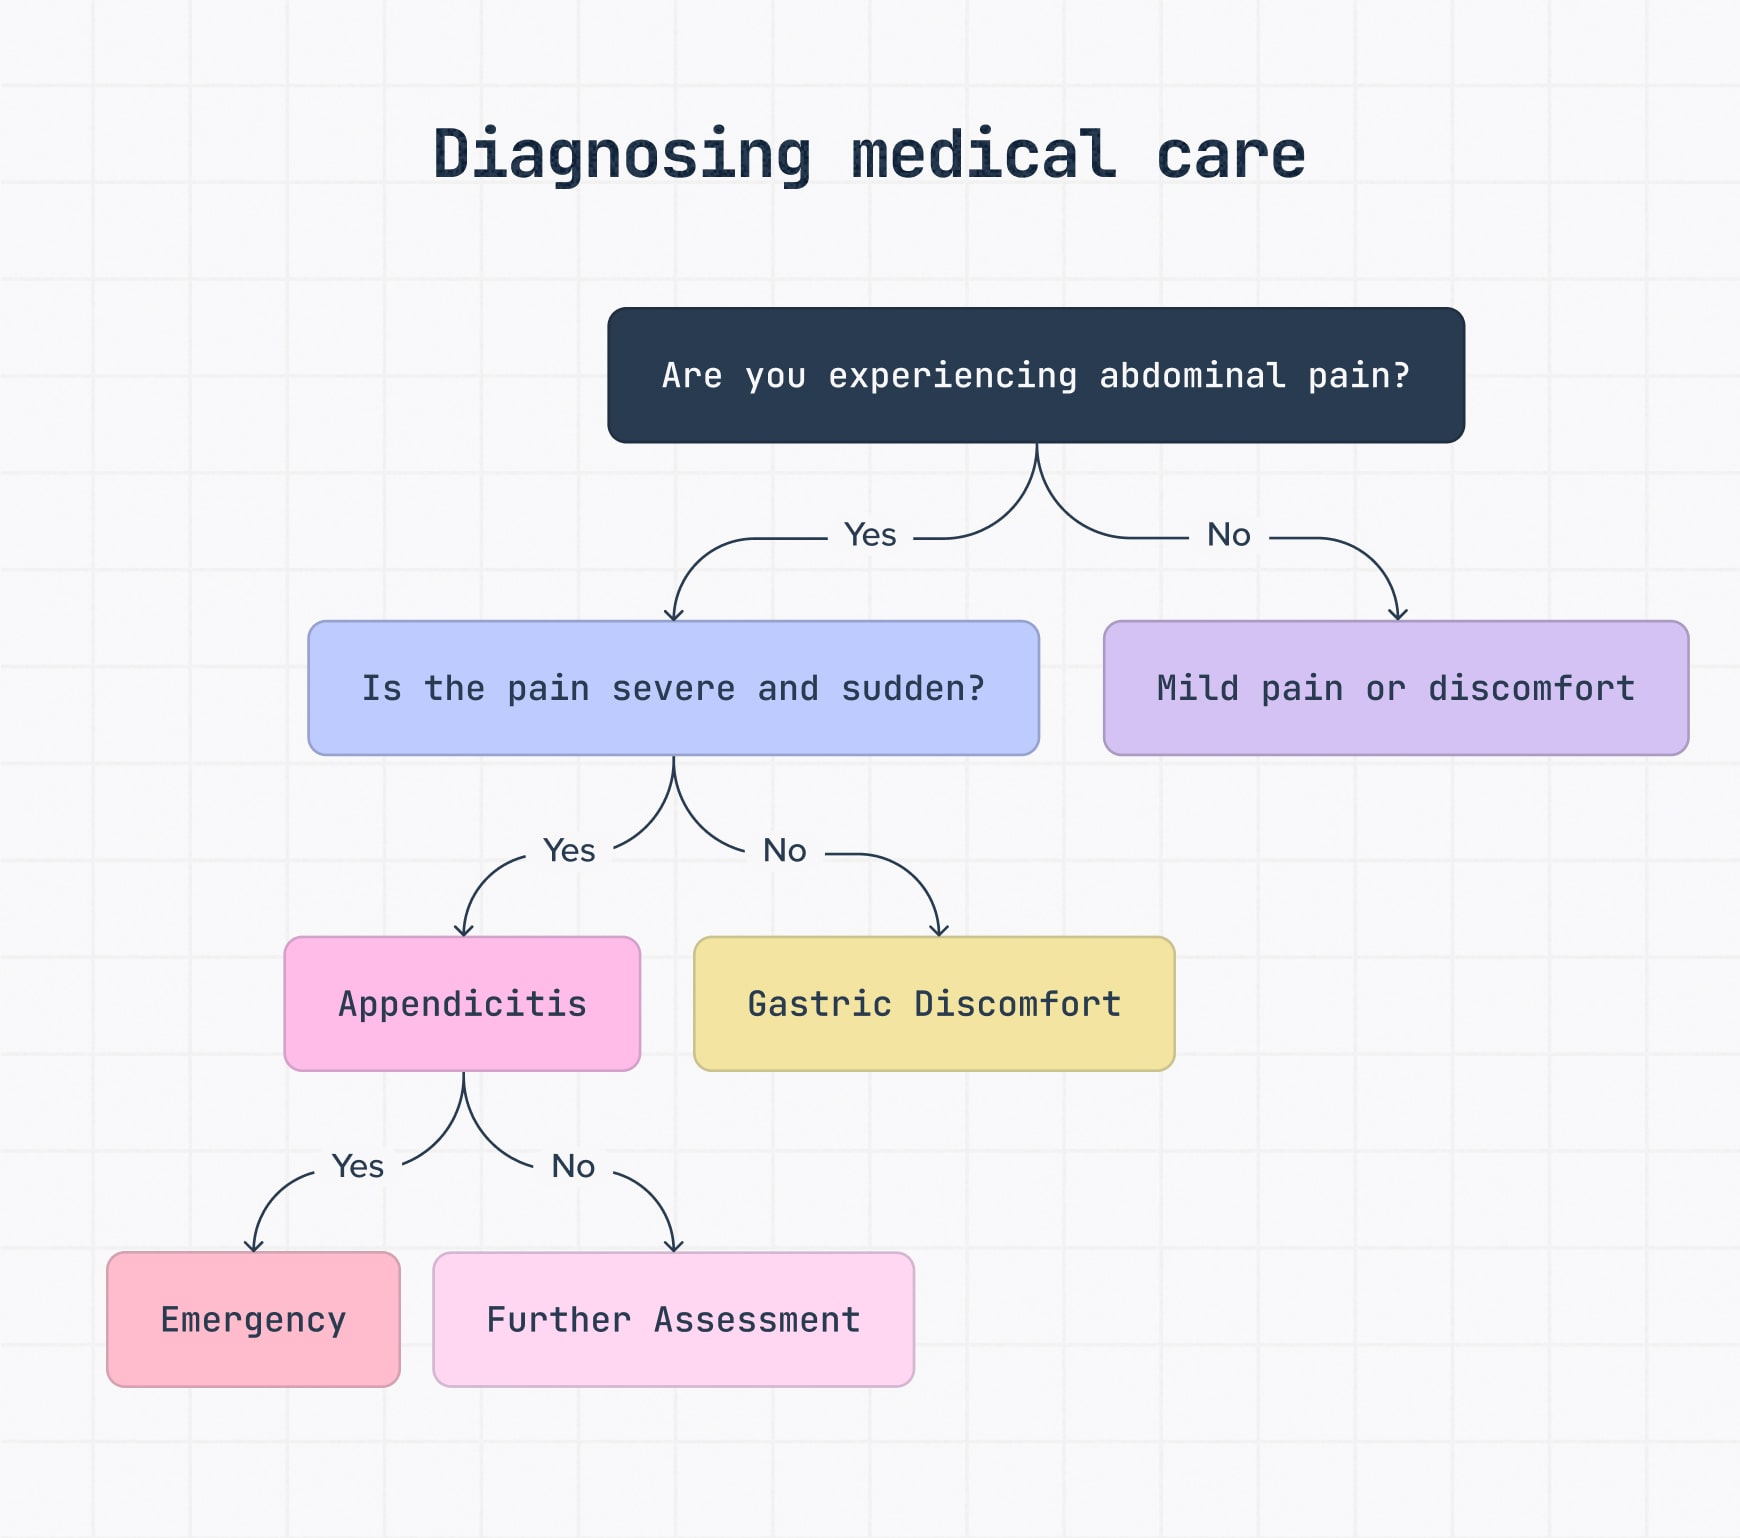
The goal isn’t to replace clinical judgment; it’s to support decision-making by giving teams a structured way to assess symptoms, reduce missed steps and escalate urgent cases faster.
SaaS product example
Decision trees can also help product and SaaS teams compare launch options before committing time, budget or resources.
Perhaps a team is deciding whether to launch a new feature now, delay it for more testing or run a limited beta first. Each path has different costs, risks and possible outcomes. A decision tree can map those paths visually, then add probabilities, estimated revenue and expected value to show which option may offer the best risk-adjusted return.
That’s already moving into decision tree analysis, which we’ll cover in more detail below.
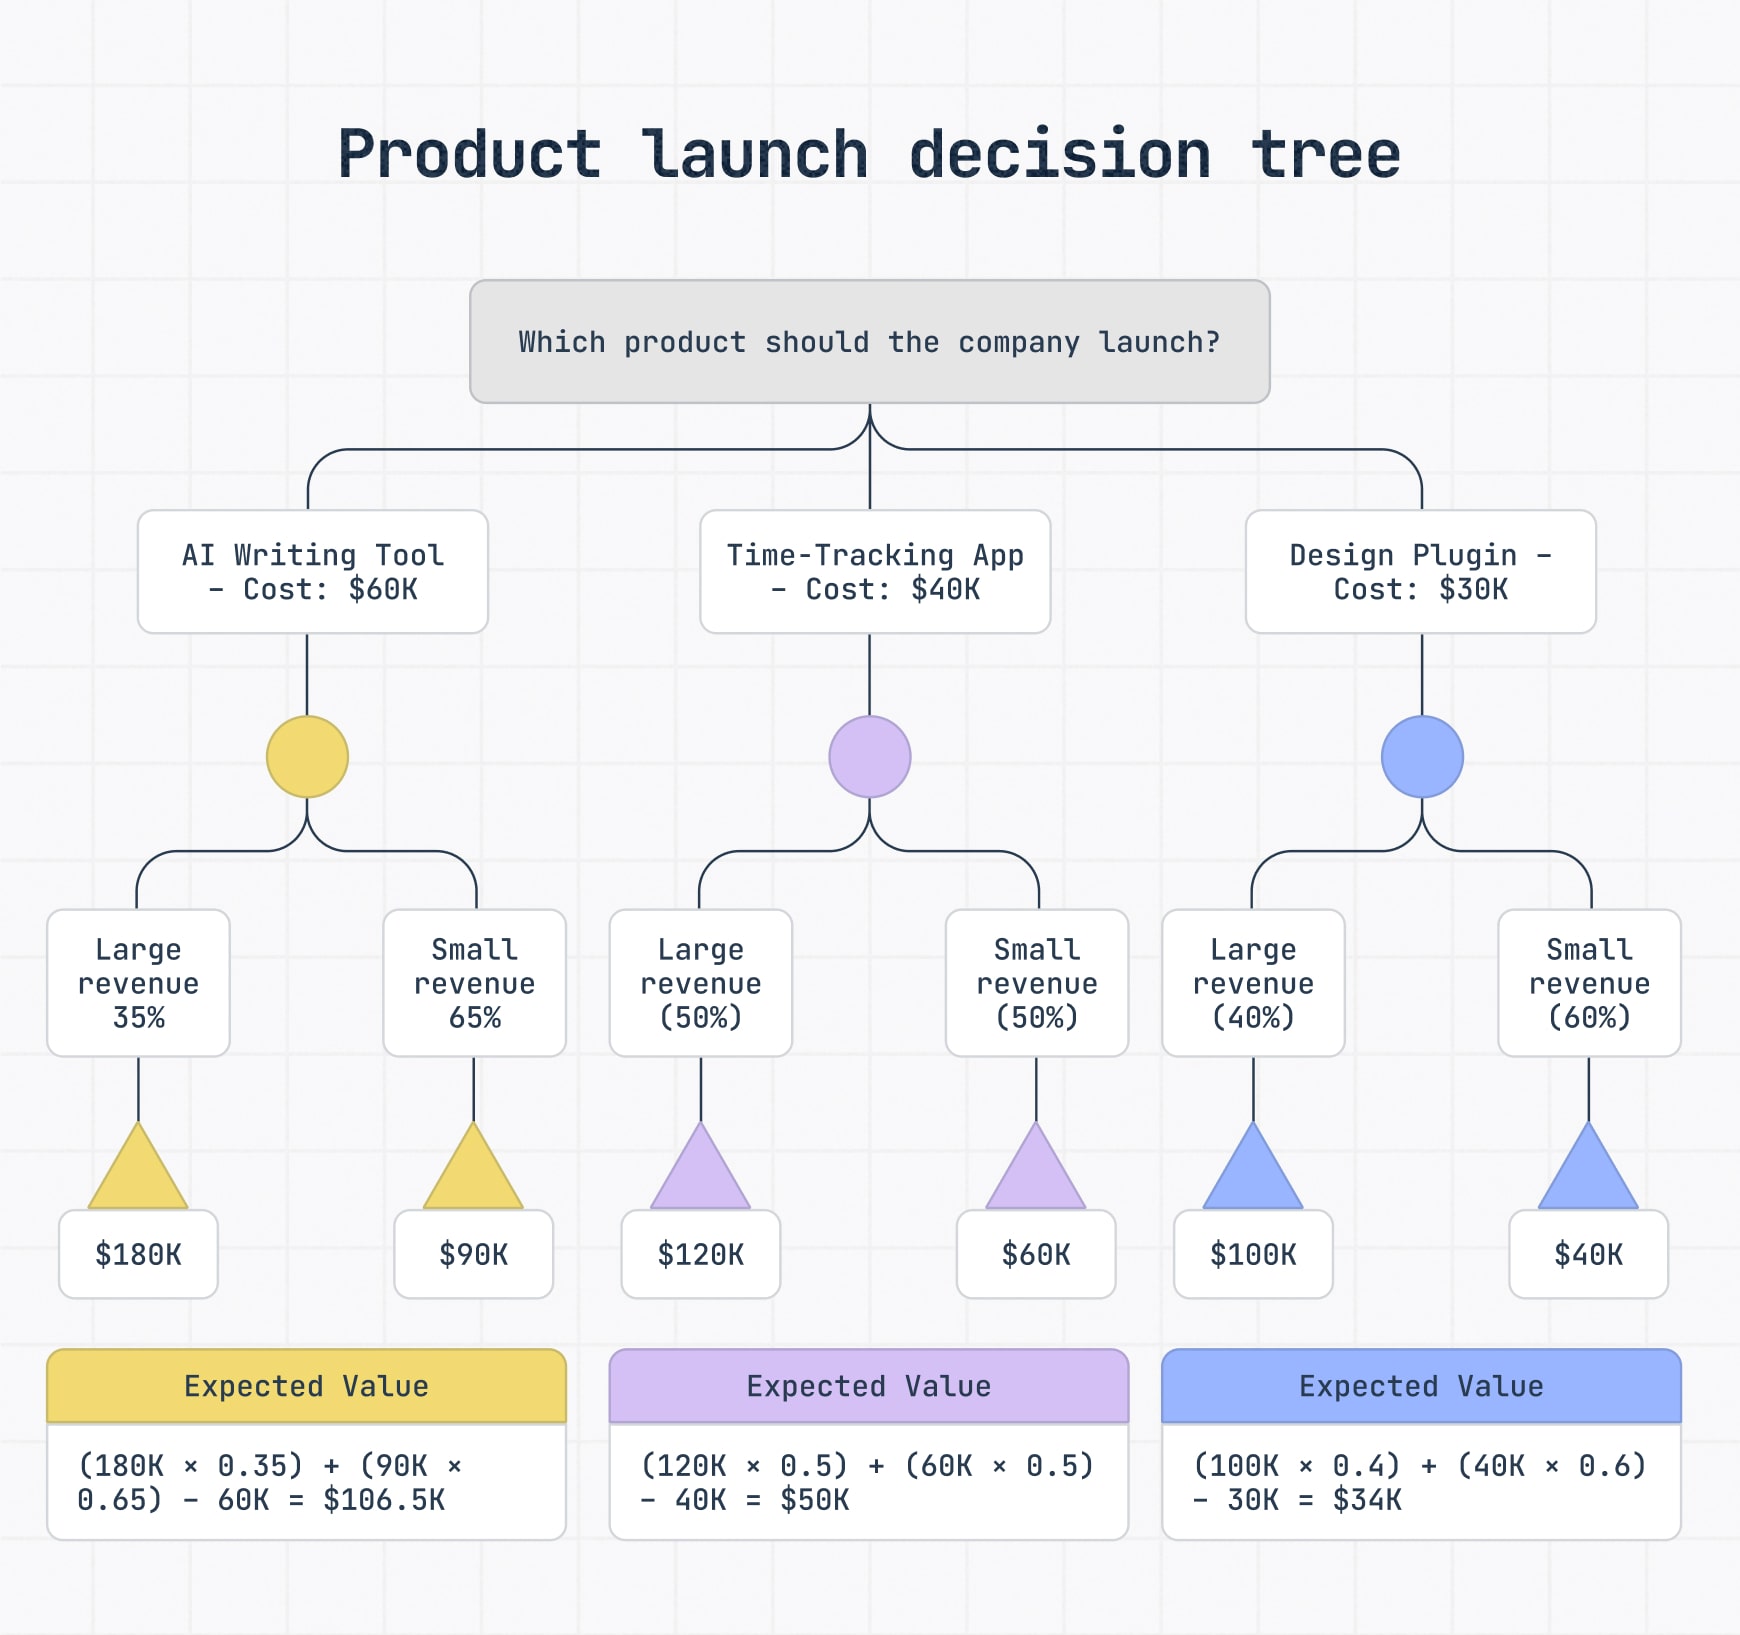
This is where decision tree analysis becomes especially useful. By weighing revenue estimates, probabilities and upfront costs together, teams can compare each option’s expected value instead of choosing based on the biggest possible upside or gut feel alone.
Types of decision trees
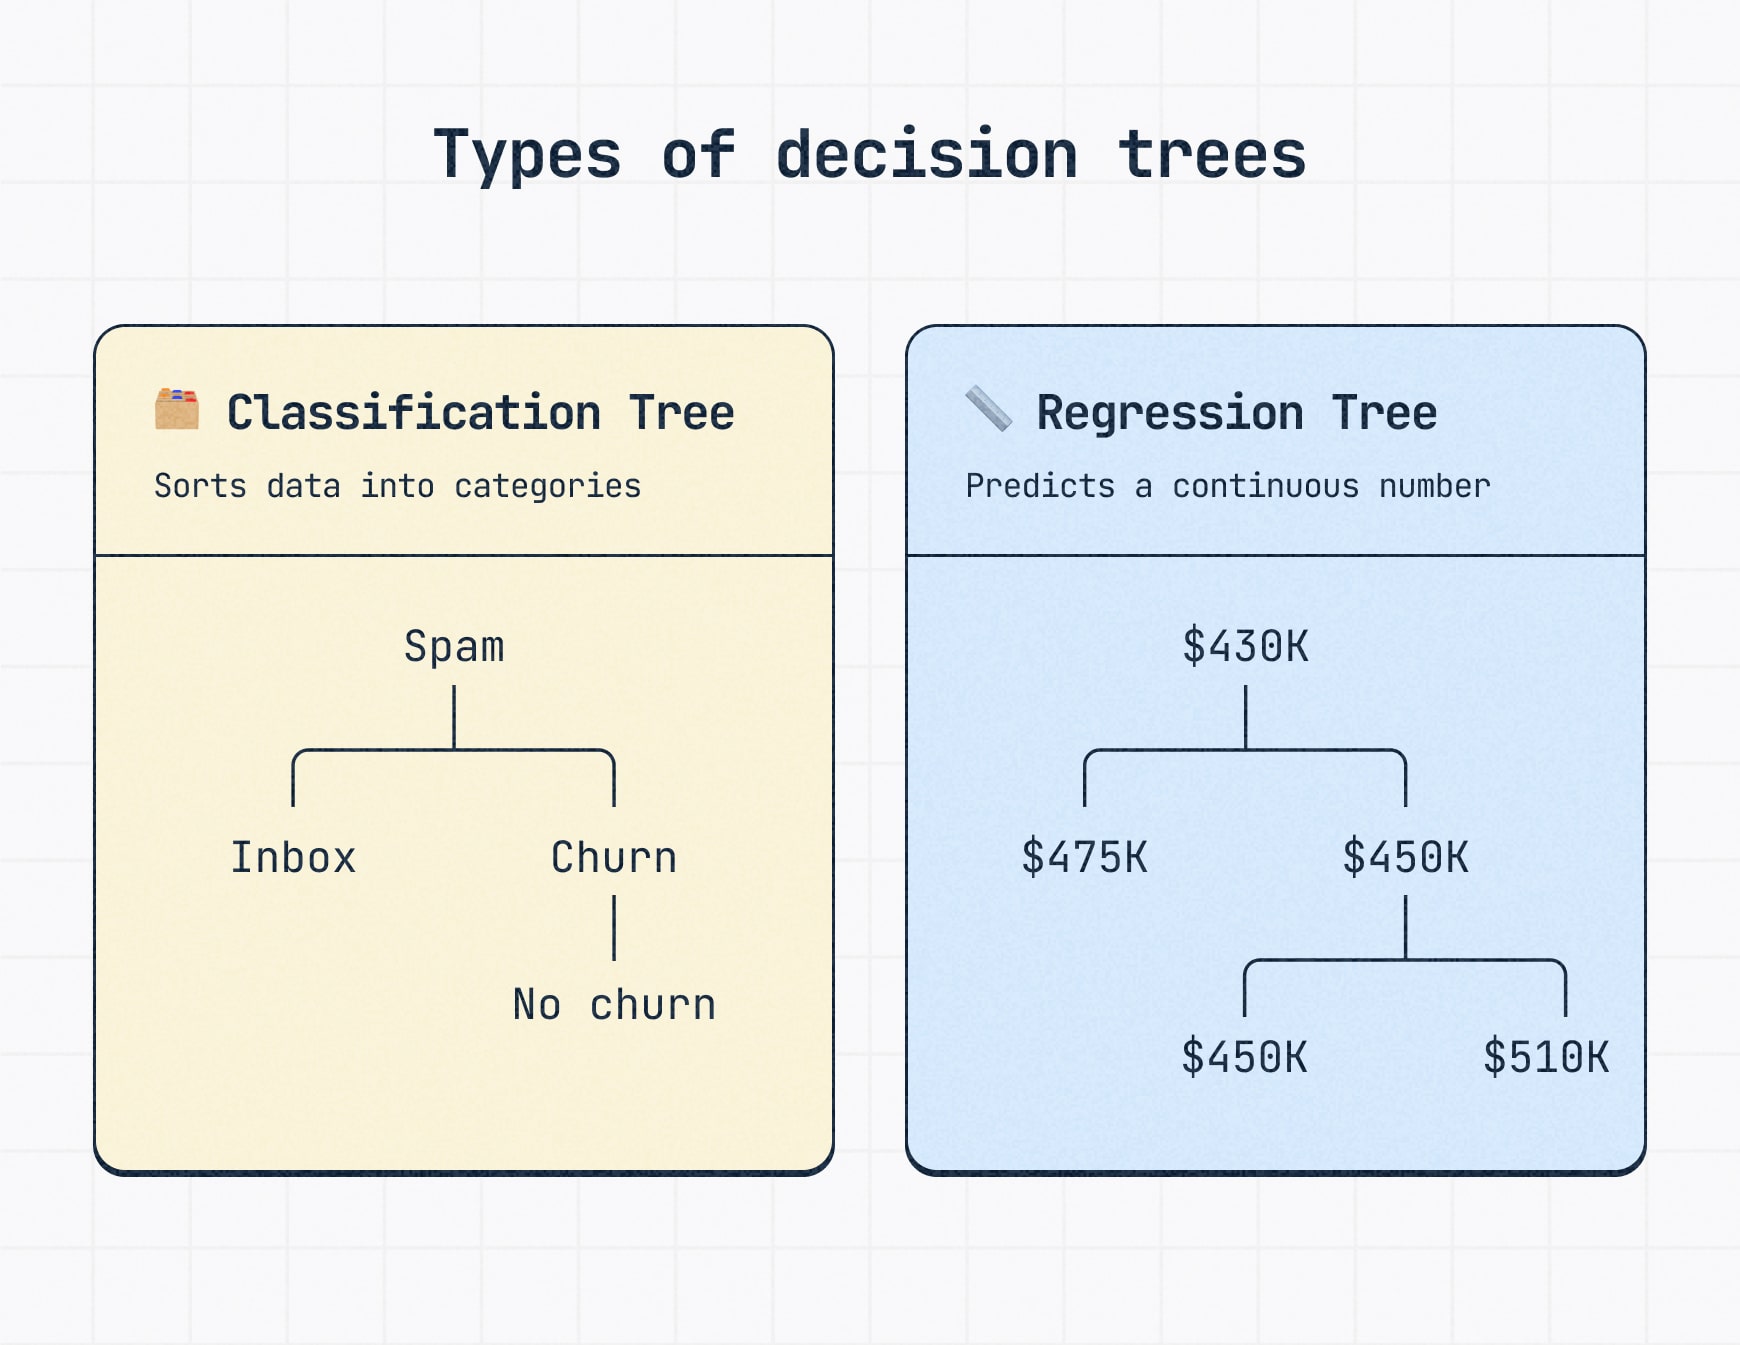
There are two main types of decision tree maps: classification trees and regression trees. The right type depends on whether you need the tree to sort something into a category or predict a number.
Classification trees
A classification tree sorts information into categories.
For example, a classification tree might sort an email into “spam” or “inbox,” label a customer as likely to churn or stay, or classify a lead as high, medium or low intent.
This type of decision tree is used when the final outcome is a category or label.
Regression trees
A regression tree predicts a number.
For example, a regression tree might estimate monthly revenue, delivery time, customer lifetime value or the likely cost of a project.
This type of decision tree is useful when the answer is a measurable amount rather than a category.
Decision trees in machine learning
In machine learning, a decision tree is a model that learns from data instead of being manually mapped by a person or team. It can classify outcomes, like sorting leads into high or low intent, or predict numbers, like revenue, cost or delivery time.
This is where decision tree algorithms come in. For predictive tasks, algorithms help the model decide how to split data, which features to test and how to balance accuracy with simplicity.
In that context, algorithms are what make decision trees trainable models, not just visual diagrams.
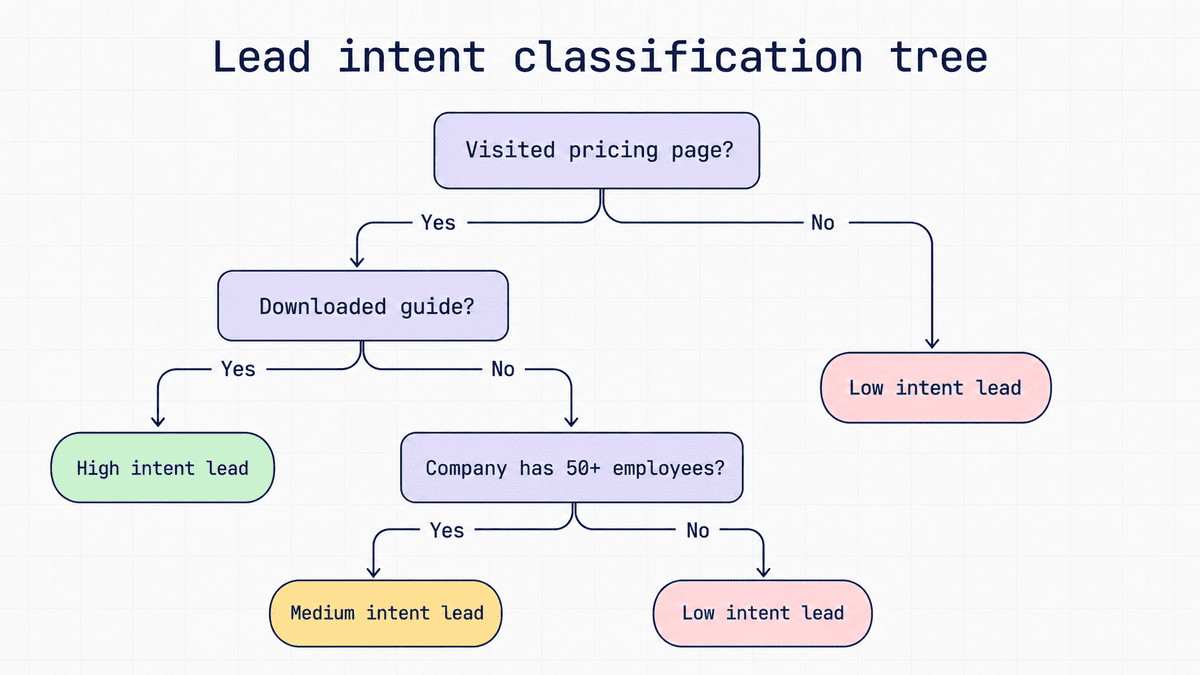
The following decision tree machine learning example shows how a sales or marketing team could classify a lead’s intent and how likely they are to become a customer. The model might look at inputs like company size, pages visited, content downloaded and past engagement. Each decision tree node checks one feature and splits the data into smaller groups until it reaches a likely outcome, like high intent, medium intent or low intent.
You don’t need to know every technical term to use a decision tree for planning or workflows, but these concepts explain how decision tree models work behind the scenes.
- Entropy: A way to describe uncertainty in a dataset. High entropy means the data is mixed or unpredictable. Low entropy means the data is more organized.
- Information gain: The reduction in uncertainty after a split. It helps the model decide which feature creates the most useful branch.
- Gini impurity: Another way to measure how mixed the data is at a node. Lower impurity usually means the split created cleaner groups.
- Overfitting: When a tree learns the training data too closely and performs poorly on new data.
- Pruning: Trimming unnecessary branches to make the tree simpler and reduce overfitting.
- Categorical data: Data that falls into groups or labels, like plan type, industry or customer status.
- Numerical data: Data measured in numbers, like revenue, price, age or delivery time.
For more advanced machine learning work, you may also see decision tree algorithms like ID3, C4.5 and CART. Random Forest and Gradient Boosting go a step further by combining multiple decision trees into tree-based ensemble models.
The goal is still to reach a useful prediction or classification. The algorithm’s job is to help the computer learn which questions to ask at each point in the tree.
A note on binary vs multi-way splits
Some decision trees work like a series of yes/no questions. Others allow more than two paths from a single decision point. Both approaches are valid; the right structure depends on your data, audience and goal.
In machine learning, tree construction usually means choosing features that create useful splits while managing issues like imbalanced data, overfitting and readability.
What is decision tree analysis?
Decision tree analysis is the process of using a decision tree to compare choices based on possible outcomes, risks, costs, probabilities and rewards.
A basic decision tree shows the path from a question to an outcome. Decision tree analysis goes further by adding details like probability, cost, revenue, effort or expected value, making it easier to compare options when the best path is not obvious.
In the product launch example above, a team could use decision tree analysis to compare whether to launch now, delay for more testing or release a limited beta. Each path can include development costs, revenue estimates, probabilities and expected value, so the team can compare the likely return of each option more clearly.
The point is not to predict the future perfectly. It’s to make the decision more structured, so the decision-makers can see the tradeoffs clearly before choosing a path.
How to build a decision tree
Building a decision tree starts with one clear decision, question or problem. From there, you map the possible choices, conditions and outcomes until each path reaches a final result. You can sketch the tree on a whiteboard or use a no-code diagramming tool to keep the structure clean, editable and easy to share.
The simple, no-code approach
For workflows, SOPs and other practical planning uses, decision tree software and flowchart tools like Slickplan’s Diagram Maker make the process easier with drag-and-drop editing, clean connectors and editable branches.
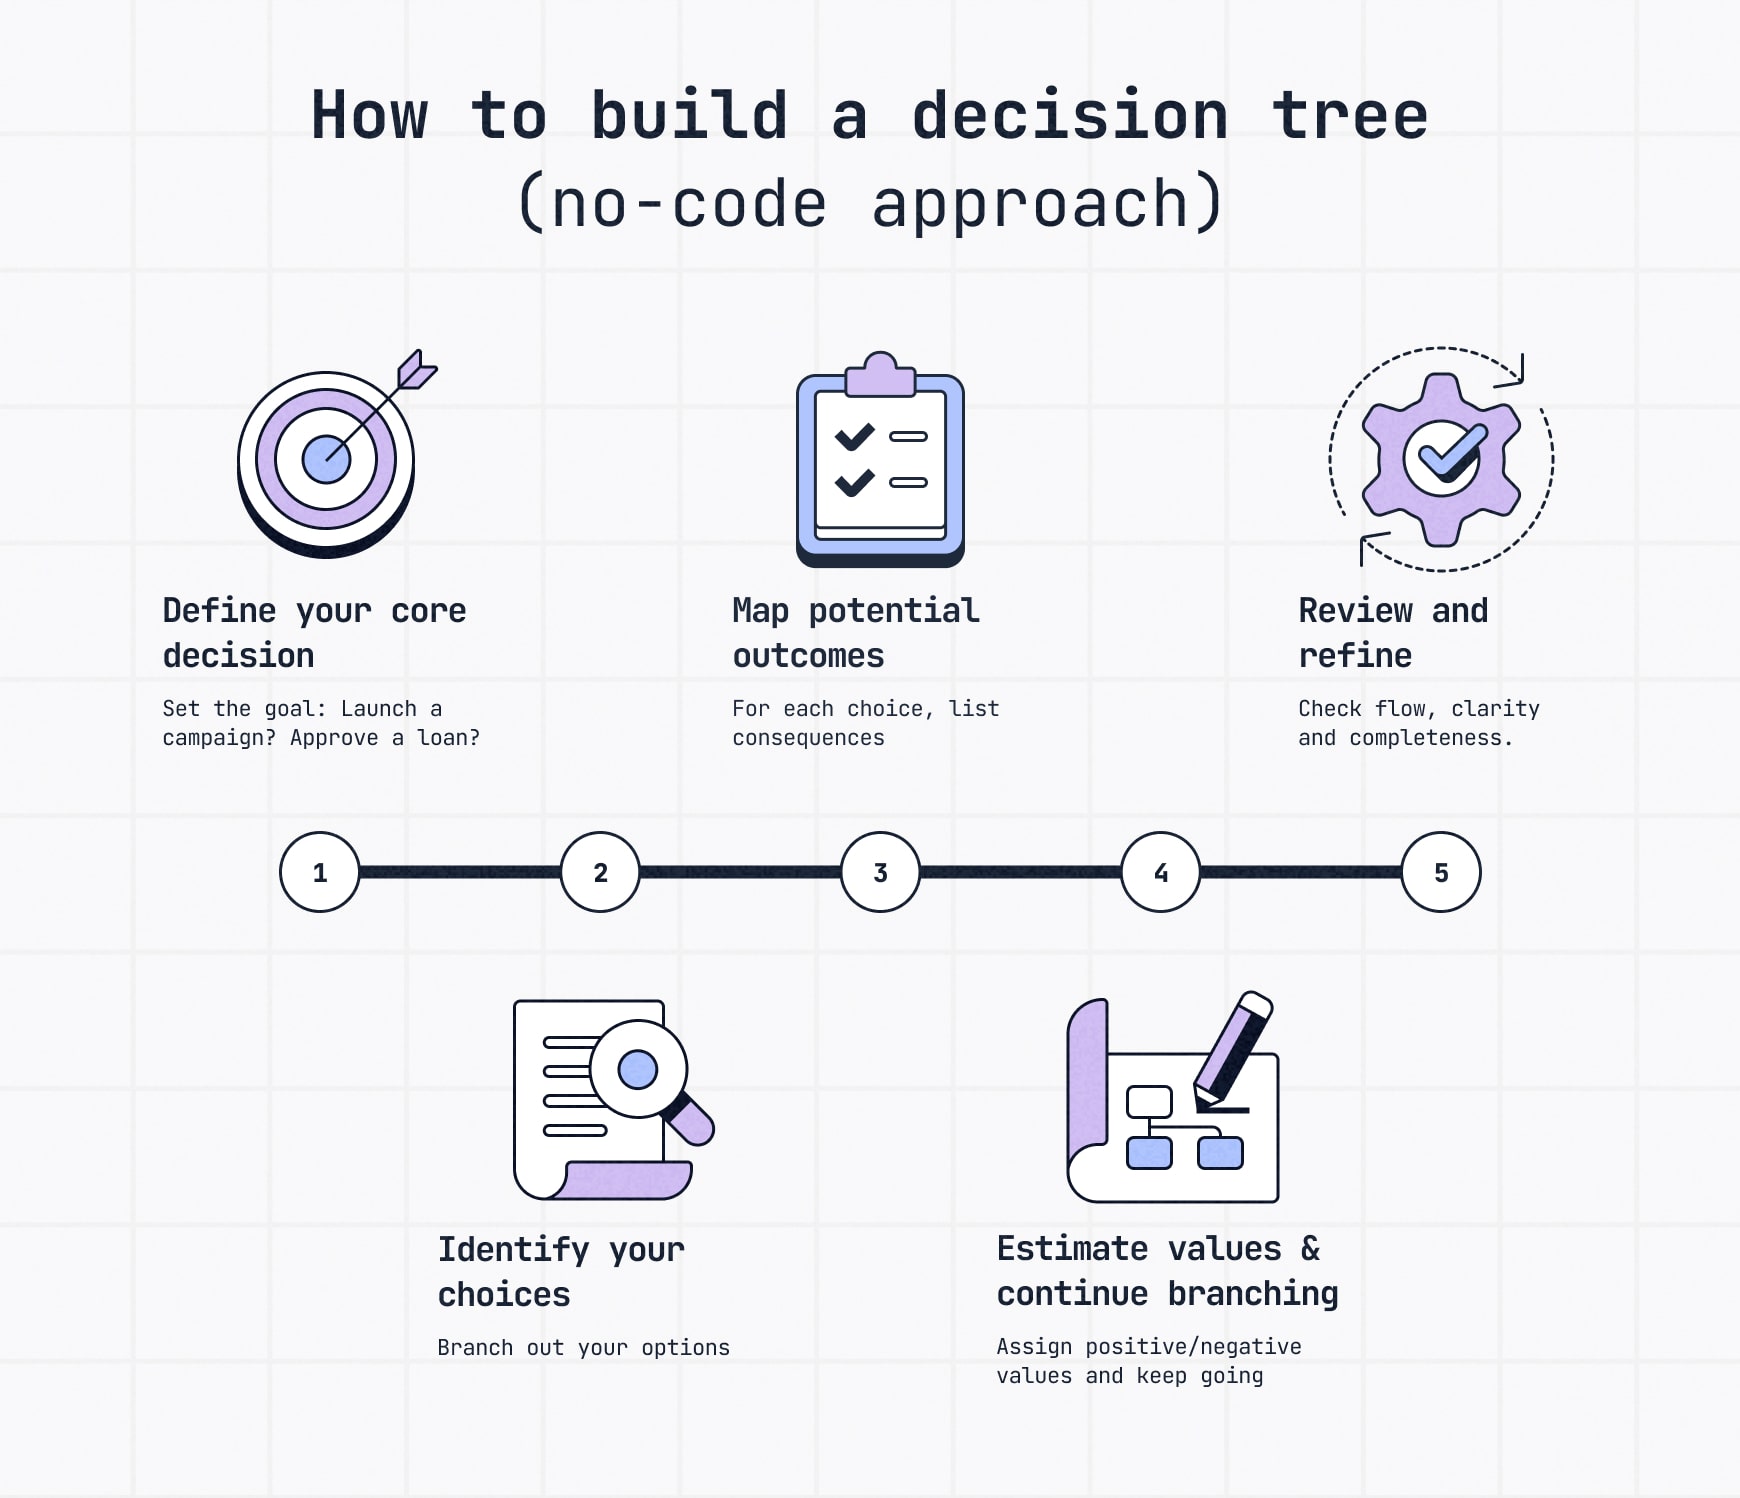
Here’s the basic no-code process:
- Define your core decision. Start with the main decision you need to make, such as whether to approve a request, launch a campaign or route a customer issue.
- Identify your choices. Add the main paths someone could take from the starting point.
- Map potential outcomes. For each choice, show what could happen next.
- Estimate values and continue branching. Add details like risk, cost, effort, likelihood or expected value where they help clarify the decision.
- Review and refine. Check for gaps, unclear labels or missing paths before sharing the tree.
For a detailed walkthrough, see our step-by-step guide on how to make a decision tree or get started now with decision tree templates.
The coding or machine learning approach
If you’re building a decision tree model for machine learning, the process is more technical. You’ll define the prediction task, prepare your dataset, train the model, evaluate performance and use the trained tree to classify or predict new outcomes.
This method is more useful for data-heavy prediction work, so here are the broad strokes:
- Define prediction task: Decide whether you’re classifying categories, like loan approval, or predicting numbers, like sales.
- Organize your data: Prepare your dataset and split it into training data for learning and testing data for evaluation.
- Train the tree model: Build the model in code, often with a language like Python, and set parameters such as depth or complexity.
- Evaluate model performance: Check how well the trained model predicts outcomes on unseen testing data.
- Add new data: Use the trained decision tree to classify or predict outcomes for new inputs.
Advantages and disadvantages of decision trees
Decision trees are popular because they make branching logic easier to see, explain and repeat. But like any decision-making tool or model, they work best in the right context.
Advantages
- Easy to understand: Decision trees are visual, so people can follow the logic from the starting question to the final outcome.
- Useful for complex choices: They break larger decisions into smaller steps, which makes messy logic easier to manage.
- Flexible across use cases: A decision tree can support business planning, customer support, UX workflows, risk analysis and machine learning.
- Helpful for team alignment: When the decision path is visible, teams can discuss assumptions, spot gaps and agree on next steps faster.
- Works with categories or numbers: Classification trees can sort outcomes into labels, while regression trees can predict numeric values.
Disadvantages
- Can become too large: If every branch has too many follow-up paths, the tree can become hard to read.
- May oversimplify messy decisions: Some choices involve context, judgment or human nuance that does not fit neatly into a branch.
- Depends on clear inputs: Vague questions, unclear labels or missing outcomes can make the tree less useful.
- Can overfit in machine learning: A decision tree model may learn training data too closely and perform poorly when applied to new data.
- May need pruning or review: Decision trees often need trimming, testing or refinement to stay accurate and easy to use.
When should you use a decision tree?
Use a decision tree when a choice, condition or result changes what happens next. It helps map the path from question to outcome so the logic is easier for people, systems or both to understand.
Business decisions
Compare options before committing money, time or resources. A decision tree can help teams weigh risks, costs and outcomes before launching a product, approving a budget, entering a market or investing in a new tool.
Standardize processes
Turn repeatable decisions into clear paths. For SOPs, approvals and internal workflows, a decision tree helps teams follow the same logic each time instead of relying on memory or informal judgment.
Project planning
Map different paths based on scope, timing, dependencies or risk. This helps teams see how one decision affects the next step before work is already in motion.
Customer support scripts
Give support teams a consistent path to follow. A decision tree can help route issues, troubleshoot problems and decide when to escalate a ticket, which is especially useful when newer team members need guidance.
Product launch planning
Compare launch options before choosing a path. For example, a team could map the tradeoffs between launching now, delaying for more testing or releasing a limited beta first.
Hiring or approval workflows
Create repeatable logic for screening candidates, reviewing requests or approving budgets. This helps reduce one-off judgment calls and makes the process easier to explain.
UX and user flow planning
Clarify what happens when users make choices. A decision tree is not the same as a user flow, but it can help UX teams map conditions, error states, branching paths and outcomes before designing the full experience.
Risk analysis
Show possible outcomes, probabilities and tradeoffs before choosing a path. This is helpful when the best option depends on cost, likelihood or impact.
Machine learning classification and regression
Use decision trees when you need a model that’s easier to interpret. In machine learning, they can classify outcomes into groups or predict numerical values while still showing how the model reached a result.
Here’s a quick breakdown of the key concepts and where each one fits.
| Concept | What it means | Best use |
|---|---|---|
| Decision tree | Branching diagram of choices, conditions and outcomes | Mapping logic and decisions |
| Flowchart | Step-by-step process diagram | Showing process flow |
| User flow | Path a user takes through a product or site | UX and journey planning |
| Decision tree analysis | Method for comparing choices using probabilities, costs and outcomes | Comparing risk, cost and expected value |
| Machine learning decision tree | Model that splits data into branches to classify or predict outcomes | Classification and regression |
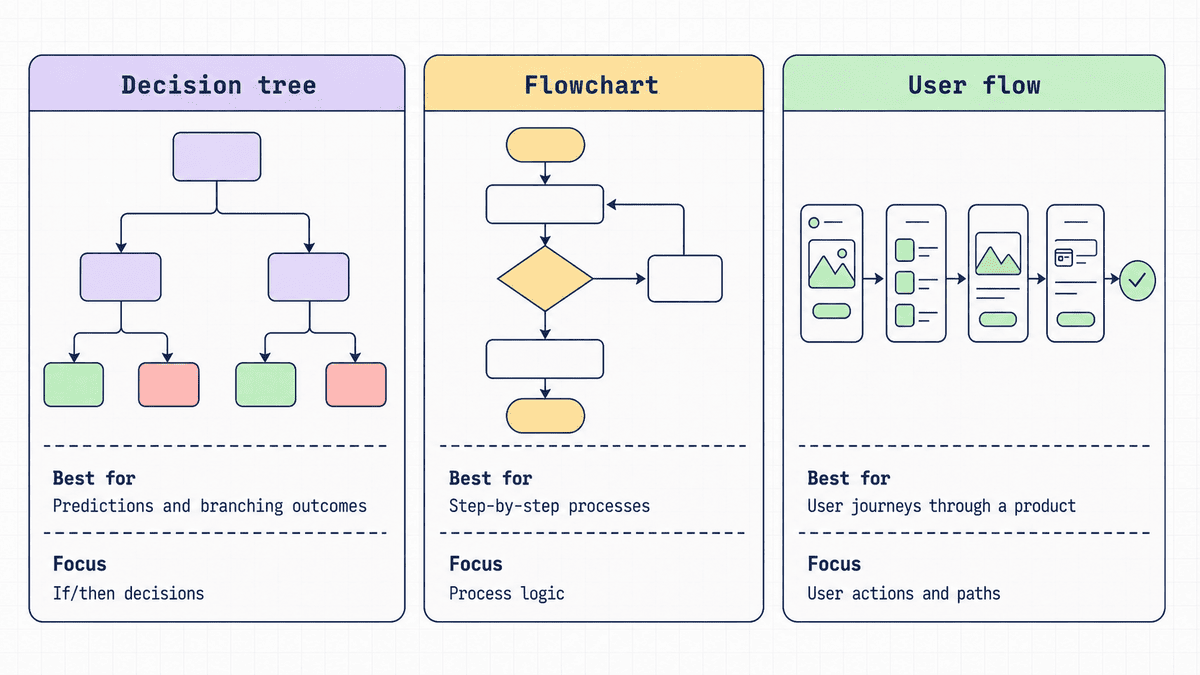
Decision tree vs flowchart vs user flow
These formats are often confused, but each one solves a different problem.
A decision tree works best when different choices or conditions create branching outcomes. If every step happens in the same order, a flow diagram would usually be clearer. For fixed step-by-step processes, it’s often better to create a flowchart. A user flow maps the path someone takes through a product or website.
Create a decision tree with Slickplan
A good decision isn’t just about choosing the right answer — it’s about understanding the path that led you there.
That’s where a decision tree helps. It gives your team a clear way to map the logic, review the paths and refine the process before decisions turn into action.
With Slickplan’s Diagram Maker, you can build decision trees alongside flowcharts, flow diagrams and user flows your team uses to plan websites, workflows and user experiences. Start with a simple branch, add choices and outcomes, then refine the structure as your thinking gets clearer.


Think visually. Improve UX with Slickplan
Build intuitive user flows, stronger customer journeys and improve information architecture.
Frequently asked questions
What is a decision tree in simple words?
A decision tree is a diagram that shows how one question, choice or condition can lead to different outcomes. You start at the first question, follow the branch that matches the answer and continue until you reach a final result, turning complex logic into something visual and easier to follow.
What is the point of a decision tree?
The point of a decision tree is to make decision logic visible and, more importantly, clear. It helps people or systems see how one choice leads to the next step and eventually to an outcome. That makes decisions easier to explain, repeat, compare and improve over time.
What is a decision tree in business?
In business, a decision tree is used to compare options and map outcomes before making a choice. Teams might use one for budget approvals, product launches, customer support workflows, hiring decisions or risk analysis. It helps make tradeoffs more visible before money or time is committed.
What is an example of a decision tree?
A simple decision tree could help decide what to do after someone abandons a cart. If the cart was not abandoned, no action is needed. If it was, the next branch might check whether the person is a returning customer before sending a reminder or discount.
What is the difference between a decision tree and a flowchart?
A decision tree maps choices, conditions and outcomes. A flowchart maps the steps in a process. Use a decision tree when different answers create different paths, and use a flowchart when a process follows a more fixed step-by-step sequence from start to finish.
What are the main parts of a decision tree?
The main parts of a decision tree are the root node, decision nodes, chance nodes, branches and leaf or terminal nodes. The root node starts the tree, branches show the possible paths from each node and leaf nodes show the final outcomes at the end of each path.
Can you create a decision tree without code?
Yes. You can create a decision tree without code by sketching it out manually or using a no-code diagramming tool. Start with the main question, add the possible choices, map the outcomes and review the tree to make sure every path is clear and complete.
What is decision tree analysis?
Decision tree analysis is the process of using a decision tree to compare choices, risks, probabilities, costs and possible outcomes. It helps teams evaluate their options when the best path depends on tradeoffs, uncertainty, likely return or multiple scenarios rather than a simple yes-or-no answer.


 X
X