Upgrade your business by improving processes, reducing errors and eliminating waste — that’s the idea behind Six Sigma and Lean methodology. Whether you’re in products or services, making processes better, makes the end result better. But it requires a data-driven approach, not a hope and prayer. A Six Sigma process map is what gets you there.
In this complete guide, we’ll take you through the goals of Six Sigma process mapping, how it helps and the types of process maps out there. Plus, we’ll hook you up with some templates at the end to help you get started.
Six Sigma process map: goals, how-to and types
Before we get into a Six Sigma-specific process map, let’s square away what process mapping is it’s a technique for creating a visual representation of workflows, steps and tasks, making it easier for your team to understand a procedure and minimizing the need for extra explanation.
A pretty handy flowchart.
Goals of Six Sigma
No matter the industry you’re in, the idea of documenting every step of the process can feel daunting. But the payoff of getting that high-level overview is worth the effort.
Visualize the whole process
Everyone may have an idea of what the entire process is and can maybe talk through it on some level, but that’s not enough to improve things or gain deeper insights.
Seeing it step by step is the ideal way.
Identify defects, redundancy and waste in your operations
The larger and more quickly a business grows, the more likely it is for inefficiencies to creep into the process and limit output.
A process map eliminates the guesswork in pinpointing problem areas, saving tons of time and even more effort later.
Streamline ops and improve processes
A detailed process map of the current state makes issues stick out like a sore thumb and allows you to improve them more easily.
Before pushing onward with changes, you can make a future state map of the new process to get a feel for how it might work.
Facilitate collaboration
A process map helps collaboration because at its core it is a communication tool used to create a common understanding of the process for your whole team.
How to Six Sigma process map: the critical first step

Before opening up your process mapping tools and getting into Six Sigma methodology, there’s one thing you need to do first to guide those process improvements.
Follow the DMAIC methodology, or put together a DMAIC process map, if you will.
- Define: Clearly define the problem you aim to correct, as well as the objectives and scope of the project
- Measure: Gather data and measure the current performance of the process
- Analyze: Analyze the data from the process to ID root causes of defects, delays and/or variations
- Improve: Implement solutions/eliminate causes that address the issues you found and improve the process
- Control: Establish control measures to ensure that improvements are sustainable
You’ll be referring to this DMAIC framework throughout the process.
And ideally, as Six Sigma looks at all of your business processes, you’ll want this to be run by an experienced project manager with a Six Sigma Black Belt.
Types of Six Sigma process maps

With you and your project team ready to get into the nitty gritty, an important question arises; which map should you use to draw the best conclusions?
Answer: Six Sigma improvements require more than one map.Many of which you can make in your flowchart software of choice.
Certain things you need to see will only come to light with certain process maps.
Six Sigma therefore taps into many types of processing mapping.
Haven’t put together something like this in a while? No problem, here’s a quick refresher on how to make a process map.
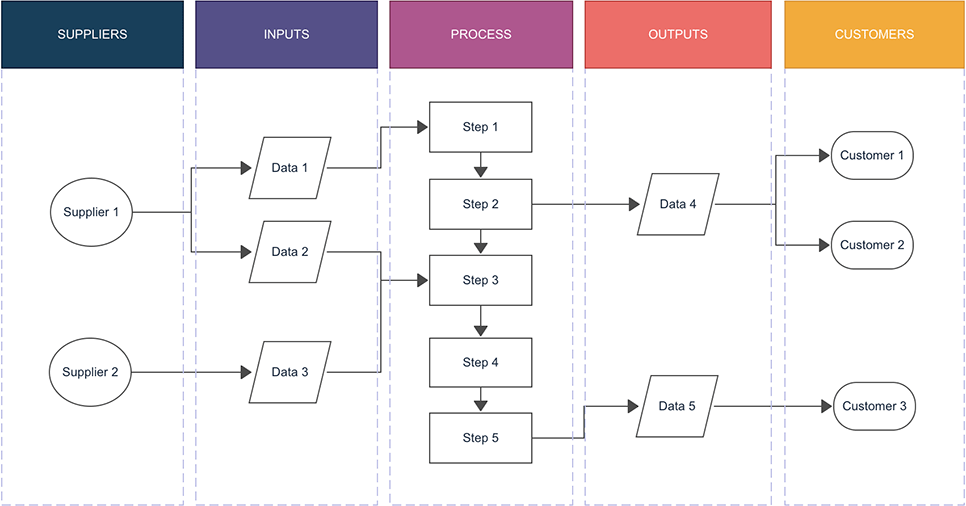
SIPOC Map
This breaks down the key elements of a process into neat categories: Suppliers, Inputs, Process, Outputs and Customers.
Sometimes you’ll see this as SIPOC(R) where the R stands for the requirements of the customer.
SIPOC is a great starting point, particularly for manufacturing, as it forces you to address and list the specifics of your entire process.
It’s not necessarily the ideal way to see the process from start to finish though because it’s more of a chart than anything else.
That’s what the next one is for.
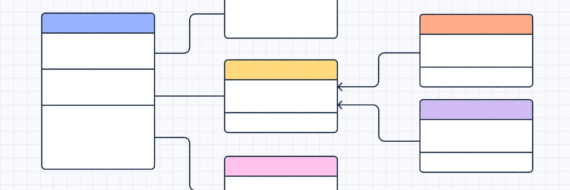
High Level Map
High level process maps are used to give you a birds-eye view of the process and the essential steps along the way — without getting into the intricate details.
A nice, simple beginning-to-end outline of the process functions.
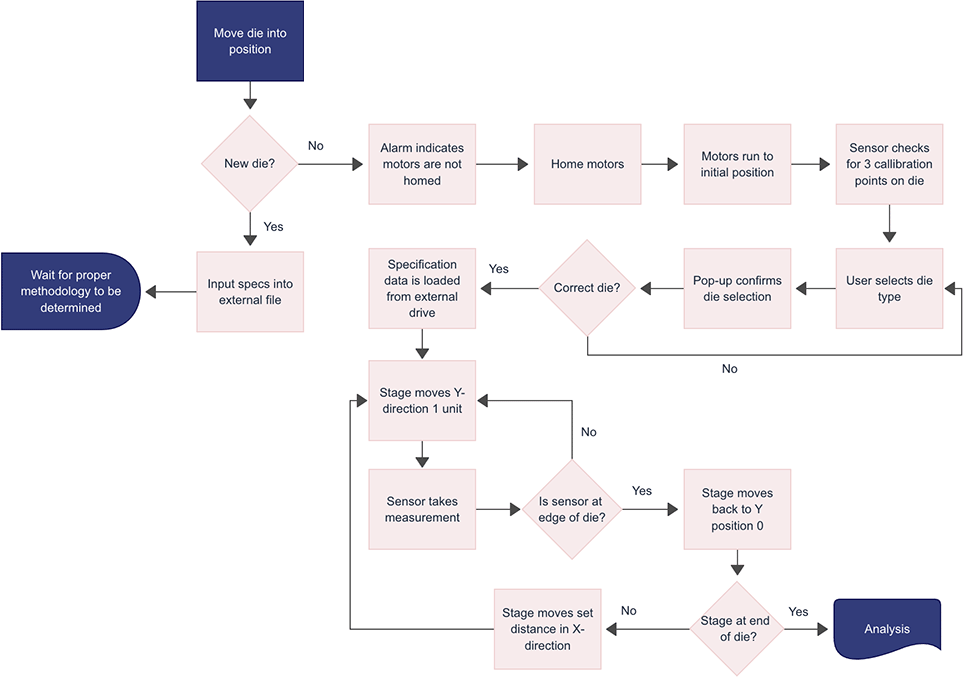
Detailed Map
This is where you get granular and into analysis mode.
The detailed map shows you the finer points of smaller processes, how inputs and outputs correlate and more.
Naturally, to get the deepest understanding of user flow, workflow and the like, you’ll want to include the stakeholders who own those operations in the mix and have them contribute their input.
Swimlane Map
This map sorts and categorizes process steps based on the roles or departments responsible for them, helping to identify handoffs, delays and potential bottlenecks in cross-functional processes.
In other words, it shows who does what.
It gets the name swimlane because it separates the project into lanes based on departments/responsibilities.
Value Stream Map
Another way to see the end-to-end process, this map is focused on highlighting both value-adding and non-value-adding steps.
The goal is to identify and eliminate wasteful steps and ultimately optimize the value delivery process by exploring more efficient ways to get the job done.
This map is essential in the Lean method which we’ll touch on next.
🎬 Learn what Slickplan can do!
We filmed a short video to show you exactly how to use Slickplan
Lean process mapping

Lean methodology has one goal: reduce waste.
Developed by Toyota in the 80s, it’s a set of principles and practices designed to eliminate waste, enhance efficiency and improve the overall flow of processes in various industries.
Waste can be overproduction, waiting times, unnecessary transportation, excess inventory, unnecessary motion, defects, underutilized talent and extra-processing.
As mentioned, the Value Stream Map is going to be doing a lot of work in Lean and is extremely valuable, but there are other tools that are quite effective.
5S Map
While the Value Stream process map is more macro, the 5S map is meant for organizing and optimizing workspaces. It shows the before and after state of a workspace, highlighting the improvements made.
The 5 S’s are: Sort, Set in order, Shine, Standardize and Sustain.
Spaghetti Diagram
A Spaghetti Diagram visually traces the physical movement of people, materials and information within a process.
It helps to identify unnecessary movement, long travel distances and bottlenecks, which can then be addressed to streamline workflows.
Current State and Future State Maps
Also known as "As Is" and "To Be" maps, Current State maps show the existing process "as is" (hence the name), highlighting areas for improvement.
Future State maps illustrate the envisioned optimized process, or the “to be” state, after the implementation of changes.
Lean Six Sigma process mapping

What’s the difference between Six Sigma and Lean Six Sigma?
While both share the goal of improving processes, Lean Six Sigma is more heavily weighted toward waste reduction while Six Sigma is about preventing defects.
Think of Lean Six Sigma as a combo of the Lean methods above with Six Sigma’s DMAIC approach to guide the process of waste elimination and provide maximum value to the user/customer with minimal inefficiencies.
To put it simply, in a Lean Six Sigma process map, if it doesn’t add value and is wasteful, it’s gotta go.
Lean, Six Sigma & Lean Six Sigma Process Map Template examples
Not sure where to start with all these different types of process maps?
No worries, we have templates that’ll help you shape your process. Whether it’s a Six Sigma process map template or a lean process mapping template you’re after, our Diagram Maker has the templates for the most widely used Six Sigma process maps.
This might be a good time to remind yourself of all the Six Sigma process map symbols.
Swimlane diagram
Our swimlane diagram template is a great starting point for understanding multi-departmental processes and who owns each part. Being able to see the duties, responsibilities and hand-off points makes it easier to find and eliminate bottlenecks.

High level process map
The high-level map template is the ideal Six Sigma process map example for getting clarity on only the essential steps of a process. Finer details are intentionally excluded, making this map useful for managers and executives who may not have the time

Detailed process map
This detailed process map template is what you’d use to get thoroughly in the weeds to build a deep level of understanding of a process. Because all the intricate, tiny elements of each step and subprocess should be included, this map is very helpful in pinpointing waste and inefficiency.
SIPOC diagram
SIPOC diagrams are a version of a high-level map and are meant to give you and your team clarity on all the component parts of a process; Suppliers, Inputs, Processes, Outputs and Customers. Use our SIPOC template to visualize yours.


Think visually. Improve UX with Slickplan
Build intuitive user flows, stronger customer journeys and improve information architecture.
Get started with Lean, Six Sigma and Lean Six Sigma process mapping now!
No matter the business you’re in, refining processes, minimizing errors and cutting waste are keys to improving your operations and hitting your targets. Leveraging the power of Six Sigma process maps is among the most helpful ways to get those tangible and sustainable results.
Getting process maps started with Slickplan’s Diagram Maker is already easy but did you know it’s also free? Yep, you can use our entire suite of tools for free for 14-days


 X
X